
FIGURE 5.
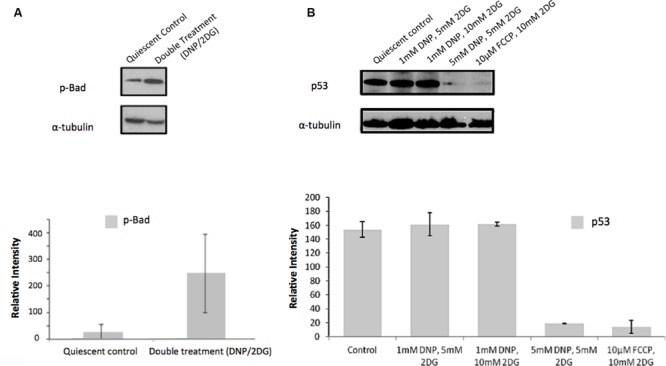
Effect of metabolic inhibitors on Bad and p53. (A) Increased Bad phosphorylation upon DNP/2DG treatment at concentrations of 5 mM each. The change is not significant. (B) Decreased p53 expression upon treatment with different inhibitors and concentrations. Results of densitometric analysis of immunoblots shown are normalized to the α-tubulin loading control. Means and standard deviations of three experiments are shown. The change is significant if compared to the control at concentrations of 5 nM DNP/5 mM 2DG and 10 μm FCCP/ 10 mM 2DG, (t-test, p < 0.001).