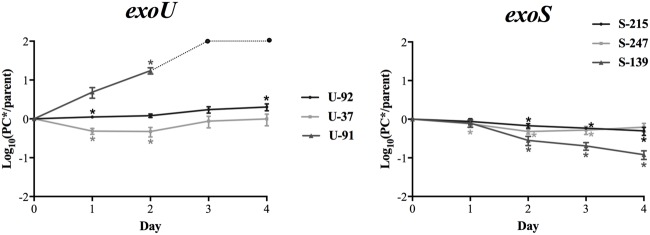
FIGURE 1.
In vitro fitness of exoU and exoS-PC∗ mutants. The average log10 CFU/ml ratio of PC∗ vs. parent strains per day of in vitro competition are shown. Ratios above zero indicate the mutant is more fit, while ratios below zero indicate a fitness cost. The ratio for exoS strains generally decreases over the course of the experiment, while the ratios for exoU strains either increases or remains stable. Results are an average of at least five independent experiments. Error bars = SEM. For strain U-91, the dotted line and circles indicate ratios after day 2 are beyond the limit of detection. ∗Indicates the PC∗/parent CFU ratio is significantly different than 1 at p < 0.05.

