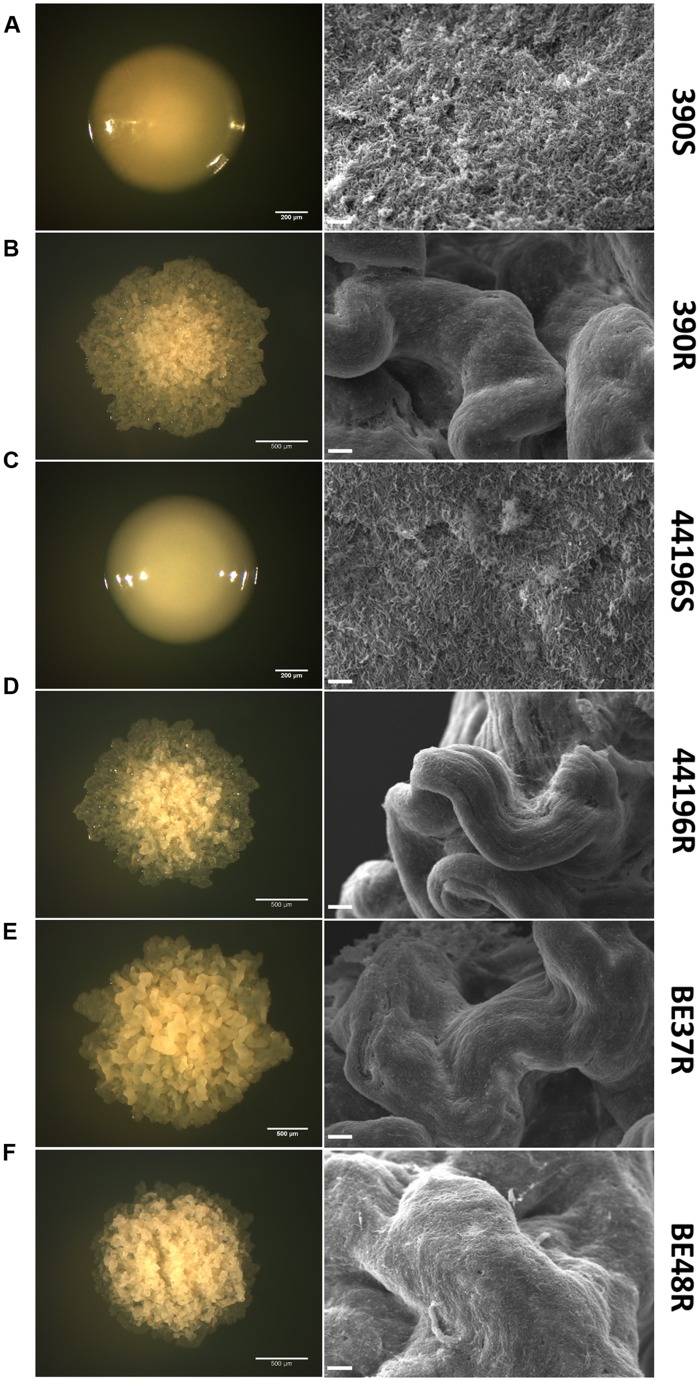
FIGURE 1.
Differences in the ultrastructure of R and S colonies. The first column represents colonies of M. abscessus 390S (A), 390R (B), 44196S (C), 44196R (D), BE37R (E), and BE48R (F) grown on trypticase soy agar plates. Bar size, 200 μm (A,C) and 500 μm (B, D–F). The second column comprises images of colonies obtained by SEM. Bar size, 10 μm.

