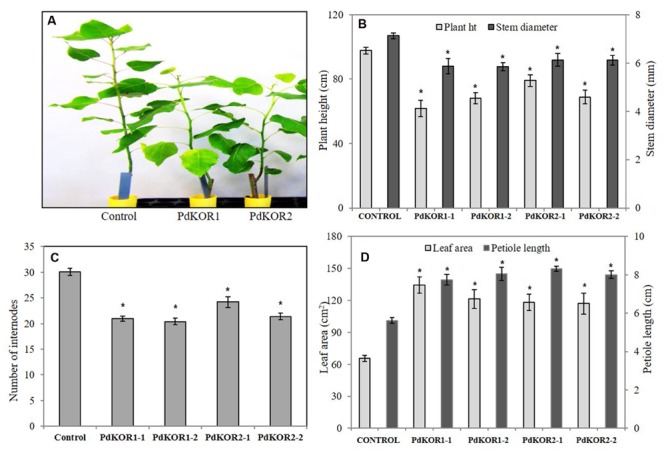
FIGURE 3.

Phenotypic characterization of PdKOR1 RNAi, PdKOR2 RNAi, and control plants. (A) Image of a two-month old control and transgenic RNAi plants propagated from stem cuttings. Measurement of (B) Plant height and stem diameter, (C) Number of internodes, and (D) Leaf area and petiole length. Please refer to left-y-axis for plant height and leaf area, and to right-axis for stem girth and petiole length. Data represent mean ± SE (n = 4–5). ∗indicates statistically significant, p ≤ 0.05 based on Student’s t-tests.
