FIGURE 5.

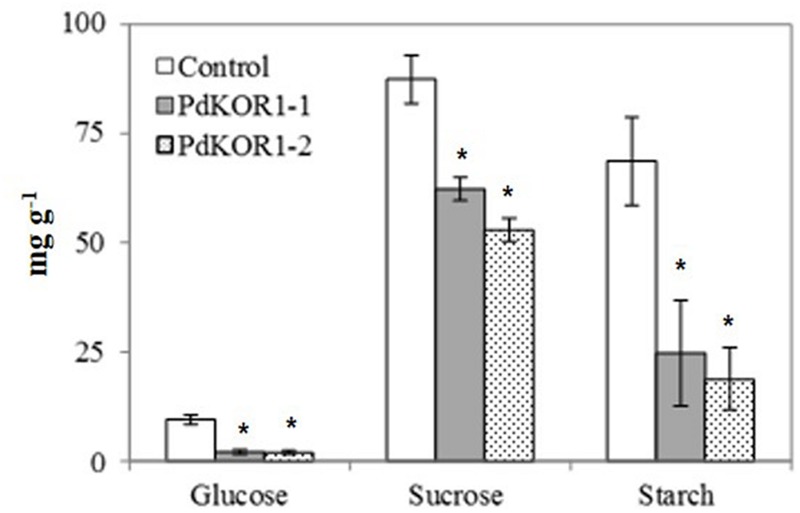
Colorimetric estimation of non-structural carbohydrates in mature leaves. Data are represented as means ± SE (n = 4). ∗indicates statistically significant, p ≤ 0.05 based on Student’s t-tests.

Colorimetric estimation of non-structural carbohydrates in mature leaves. Data are represented as means ± SE (n = 4). ∗indicates statistically significant, p ≤ 0.05 based on Student’s t-tests.