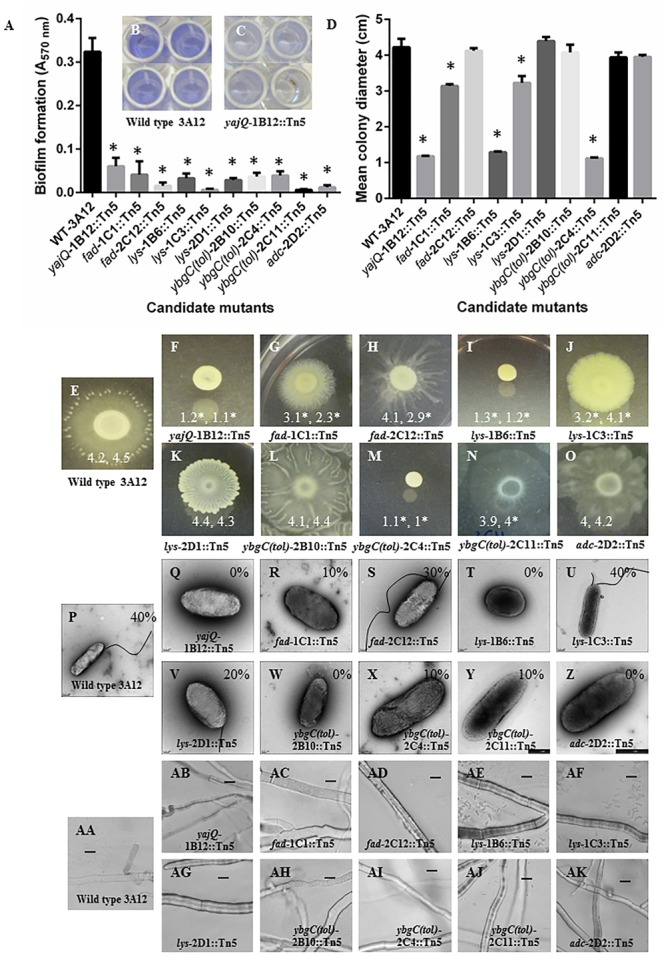
FIGURE 3.

Characterization of the candidate anti-fungal mutants of endophyte strain 3A12. (A–C) Colorimetric biofilm formation assays. (A) Graph showing biofilm formation (Crystal violet, A570 nm) for the wild type and candidate mutants. (B,C) Representative images for (B) wild type strain 3A12, and (C) mutant yajQ-1B12::Tn5. (D–O) Motility assay of the candidate anti-fungal mutants on LB agar plates. (D) Graph showing mean colony diameter (cm) for the wild type and candidate mutants (n = 21). Asterisks indicate significant difference from wild type strain 3A12. (E–O) Representative images of colony formation for wild type 3A12 and candidate mutants. The two numbers shown in (E–O) indicate the mean colony diameter (n = 21) with the asterisks indicating significant difference in two independent trials. (P–Z) Detection of flagella using transmission electron microscopy (TEM) for wild type strain 3A12 and mutants. The numbers shown in (P–Z) indicate the percentage of bacteria that were observed to have flagella. (AA–AK) Examination of mutants for their ability to swarm, attach and form microcolonies around their fungal target. Shown are light microscopy images of S. homoeocarpa mycelia grown on a microscope slide side by side with wild type 3A12 or mutant strains. Bacteria are not visible around the mycelia in some images which reflects the inability of those strains to reach the fungal pathogen. The scale bar is 20 μm.
