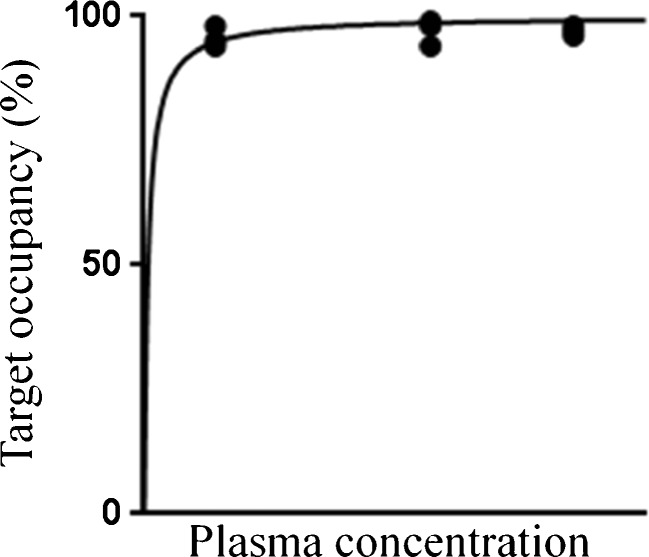
Fig. 2.
Example of occupancy results following administration of three different doses of the test drug. In this particular case, drug doses were fixed prior to the start of the PET study and almost all occupancy values were close to 100 %, providing little information on the upslope of the binding curve. This can be avoided by the use of an adaptive design, where each drug dose is based on the results of the previous measurement(s)

