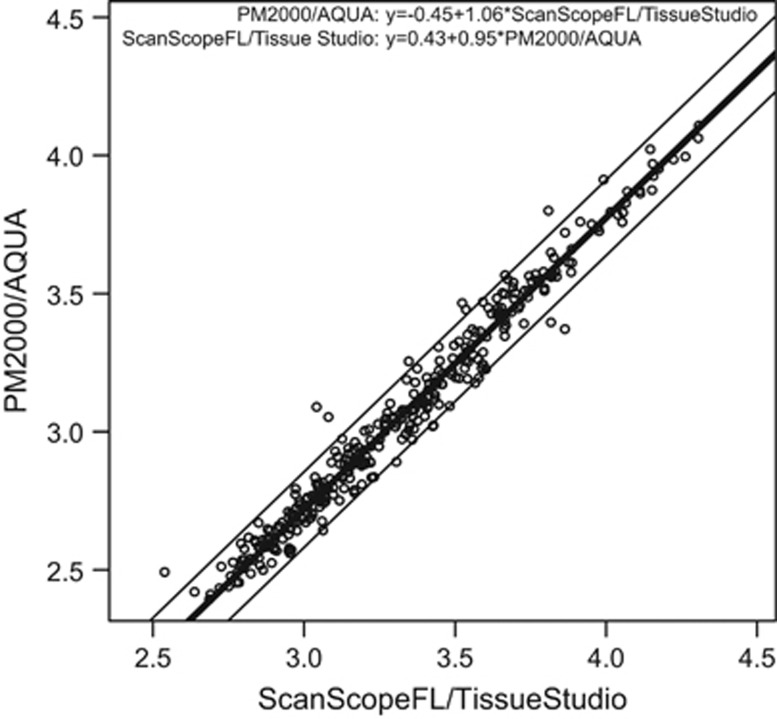
Figure 1.
Two technologically distinct platforms for fluorescent image capture and quantitative analysis produce highly concordant quantitative immunohistochemistry values. Quantitative fluorescence immunohistochemistry for nuclear pYStat5 was performed on a cohort of 323 breast cancer patients using two distinct methodologies, PM2000 image capture/AQUA software (PM2000/AQUA) and ScanScopeFL image capture/TissueStudio software (ScanScopeFL/TissueStudio). Log-transformed fluorescence immunohistochemistry values from each platform are displayed by scatter plot. Assay comparison analysis subsequently was performed to generate linear calibration equations from the Bland–Altman difference vs mean regression. The thick line corresponds to the conversion equation from Tissue Studio to AQUA log-transformed values, and the thin lines represent the transformed 95% limits of agreement. The two fluorescence immunohistochemistry methodologies showed excellent concordance following linear calibration.

