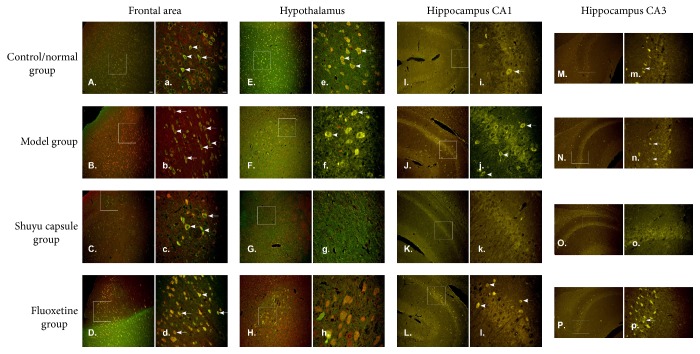
Figure 3.
5-HT3AR- and 5-HT3BR-positive cell staining. 5-HT3AR- and 5-HT3BR-positive cells from different cerebral areas were stained, including the frontal lobe (A–D, a–d), hypothalamus (E–H, e–h), hippocampus CA1 (I–L, i–l), and hippocampus CA3 (M–P, m–p). The following samples were stained with both 5-HT3AR and 5-HT3BR antibodies: the control/normal group (A, E, I, M, a, e, I, and m), model group (B, F, J, N, b, f, j, and n), Shuyu capsule group (C, G, K, O, c, g, k, and o), and positive-control fluoxetine group (D, H, L, P, d, h, l, and p). 5-HT3AR- and 5-HT3BR-positive cells were defined by the merged signal (yellow). Scale bar (A–P): 100 μm; scale bar (a–p): 25 μm.

