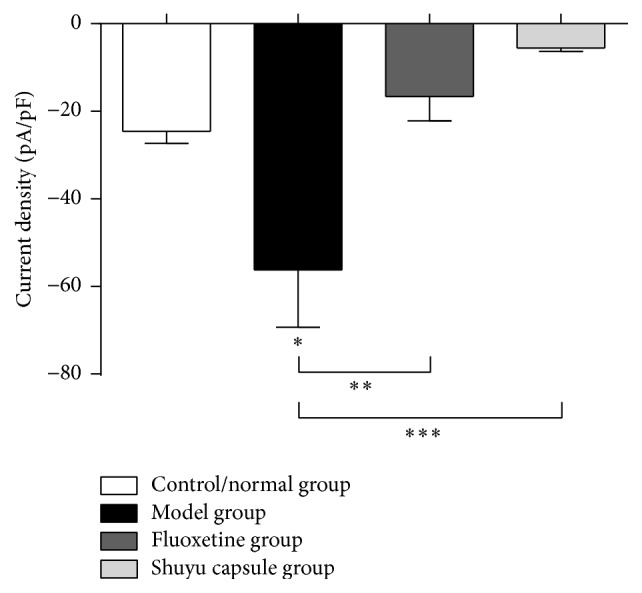
Figure 5.

Whole-cell patch clamp analysis of primary hippocampal neurons. In this assay, 5-HT3R currents were recorded and analyzed for the following groups: the control/normal group (white), model group (black), positive-control fluoxetine group (charcoal gray), and Shuyu capsule group (gray). n = 6, ∗ P < 0.05, ∗∗ P < 0.01, and ∗∗∗ P < 0.001.
