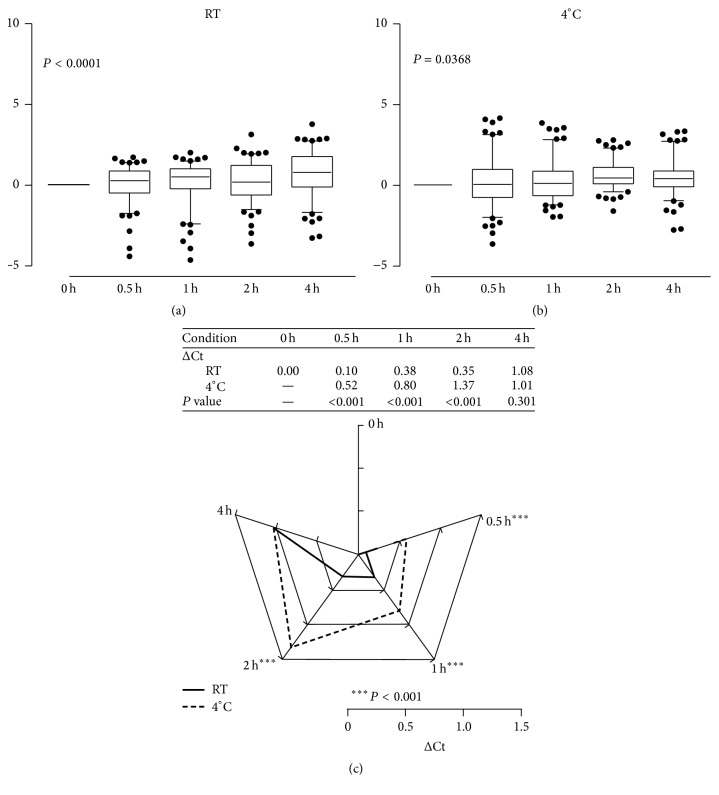
Figure 3.
Plasma storage condition test. The miRNA expressin patterns at time 0 h, 0,5 h, 1 h, 2 h, and 4 h for storage at (a) RT and (b) at 4°C. (c) Average change in Ct value in five clinical samples of plasma stored for varying durations ranging from 0.5 h to 4 h at RT and at 4°C. From 0.5 h to 2 h, the delta Ct was more stable at RT than at 4°C. The scale indicates the delta Ct value of the qPCR result in comparison with time 0.

