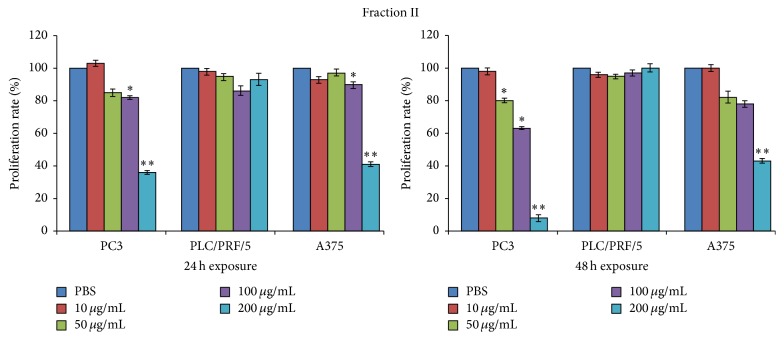
Figure 6.
Evaluation of the proliferation rate percentage (incorporation of BrdU) of PC3, PLC/PRF/5, and A375 cancer cell lines after 24 and 48 h of culture with or without 10 μg/mL, 50 μg/mL, 100 μg/mL, and 200 μg/mL of the fraction II. Data are expressed as the mean ± SD of three different experiments in triplicate. All statistically significant differences were evaluated with ANOVA nonparametric test, comparing the untreated sample with each of the different concentrations of the three fractions, and are displayed at the top of the corresponding histogram when present (∗ p < 0.05; ∗∗ p < 0.01).

