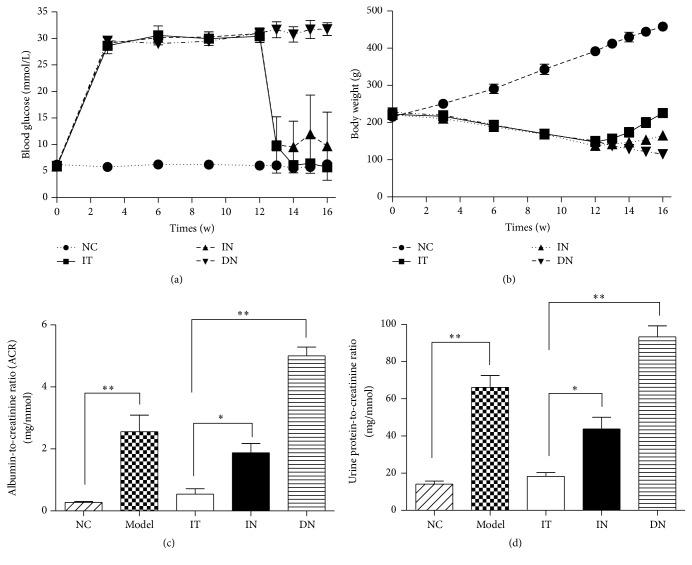
Figure 1.
Blood glucose levels and body weights over 16 weeks and urinalysis results for each group. (a) Nonfasting blood glucose levels for each group. (b) Body weight changes over 16 weeks. (c) Random urine albumin-to-creatinine ratios (ACR) for each group, ∗ p = 0.002 and ∗∗ p < 0.001. (d) Urine protein-to-creatinine ratios for each group, ∗ p = 0.001 and ∗∗ p < 0.001. Model group: diabetic nephropathy model rats established at 12 weeks.

