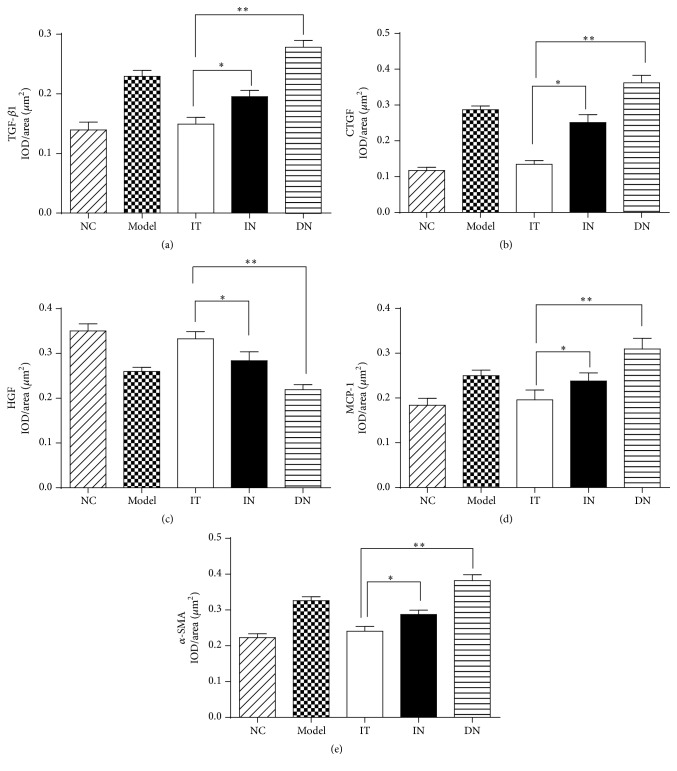
Figure 5.
Measurement of IOD/area of immunohistochemical staining of renal fibrogenic and interstitial fibrosis factors. (a) Measurement of IOD/area of TGF-β1, ∗ p = 0.013, and ∗∗ p < 0.001. (b) Measurement of IOD/area of CTGF, ∗ p = 0.002 and ∗∗ p < 0.001. (c) Measurement of IOD/area of HGF, ∗ p = 0.001 and ∗∗ p < 0.001. (d) Measurement of IOD/area of MCP-1, ∗ p = 0.001 and ∗∗ p < 0.001. (e) Measurement of IOD/area of α-SMA, ∗ p = 0.018 and ∗∗ p < 0.001. IOD/area, integrated optical density/area. The mean of IOD/area of positive staining was used to accurately measure the degree of positive expression in immunohistochemical staining. Model group: diabetic nephropathy model rats established at 12 weeks.

