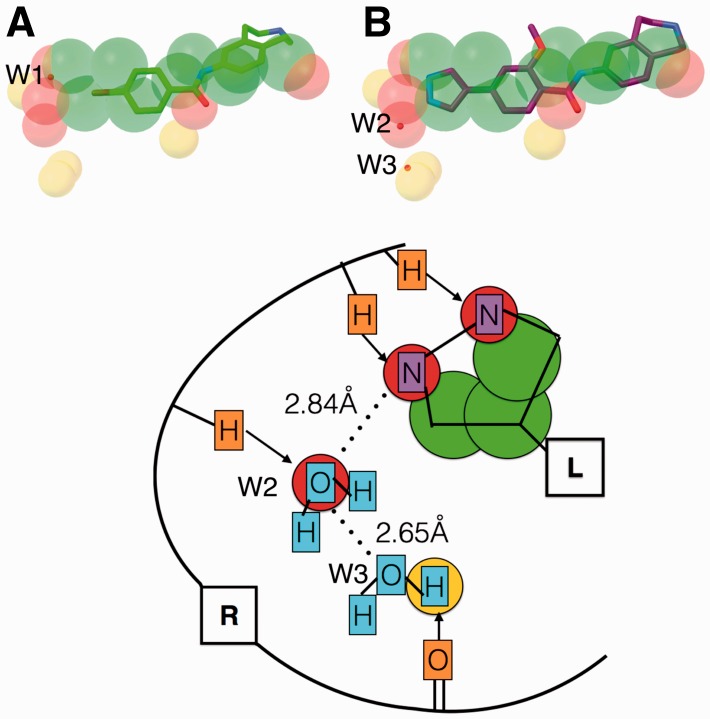
Fig. 5.
(A) Predicted feature points represented as spheres (carbon – green; oxygen – red; and hydrogen – yellow) overlaid with 4d2w bound fragment (stick and balls; carbon – green). B) Fragment optimized inhibitor (stick and balls; carbon – purple) overlaid with the fragment and the predicted feature points for 4d2w. The crystallographic water molecules are shown as small red spheres. C) Schematic illustration of (B): Receptor (R: atoms - orange) interactions (arrows) are used to extract the feature points represented as circles (green - carbon; red - oxygen; yellow- hydrogen). Predicted feature points capture the ligand atoms (L: atoms - purple) and water molecules (cyan) (Color version of this figure is available at Bioinformatics online.)

