
Figure 4.
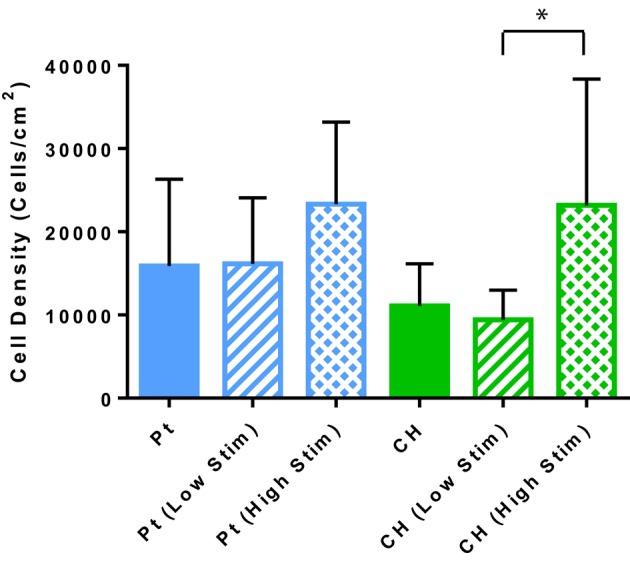
The estimated OEC density on each sample as determined by the cell concentration measured with the Tali. Error bars represent the standard error of the mean. (t-test, *significant difference, p < 0.05, N = 3).
Official websites use .gov
A
.gov website belongs to an official
government organization in the United States.
Secure .gov websites use HTTPS
A lock (
) or https:// means you've safely
connected to the .gov website. Share sensitive
information only on official, secure websites.
The estimated OEC density on each sample as determined by the cell concentration measured with the Tali. Error bars represent the standard error of the mean. (t-test, *significant difference, p < 0.05, N = 3).