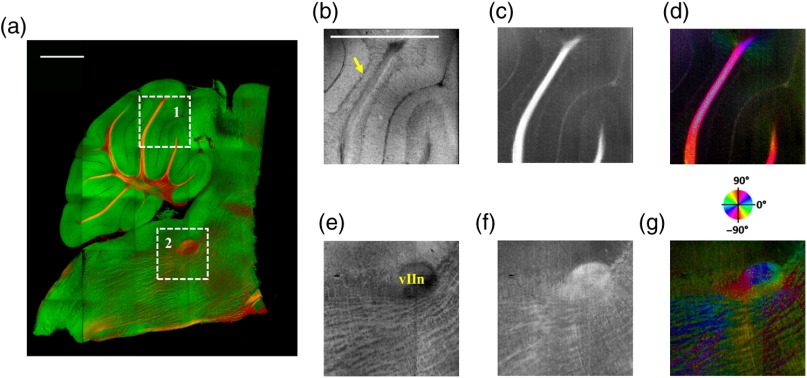
Fig. 6.
High-resolution en-face images of a sagittal section. (a) Composite image of reflectivity (green) and retardance (red). Dashed boxes represent ROIs. (b) and (e) Reflectivity, (c) and (f) retardance, and (d) and (g) axis orientation images show these contrasts for the fine structures in ROI-1 and ROI-2, respectively. Arrow in (b) indicates Purkinje cell layer. vIIn in (e) denotes the facial nerve. (d) and (g) Axis orientation is color coded in HSV space by the color wheel, and the brightness is regulated by retardance values. Scale bars in (a) and (b): 1 mm.

