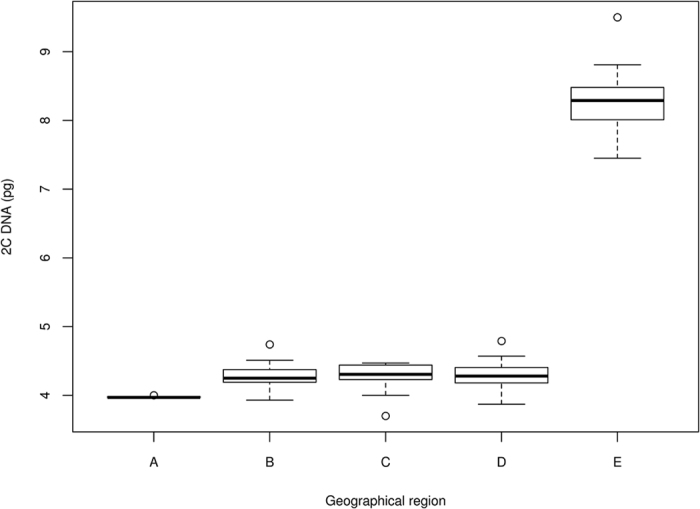
Figure 3. Box-plot graph of 2C nuclear DNA contents in M. lutarioriparius from five geographic regions.

1: upstream Hubei Province; 2: upper and middle reaches Huna Province; 3: upper and middle reaches Hubei Province; 4: middle reaches Anhui Province; 5: downstream Jiangsu Province. Horizontal line represent the median, boxes span the interquartile range, and whiskers the non-outlier ranges. Circles denote outliers. The figure was drawn by R version 3.0.2.
