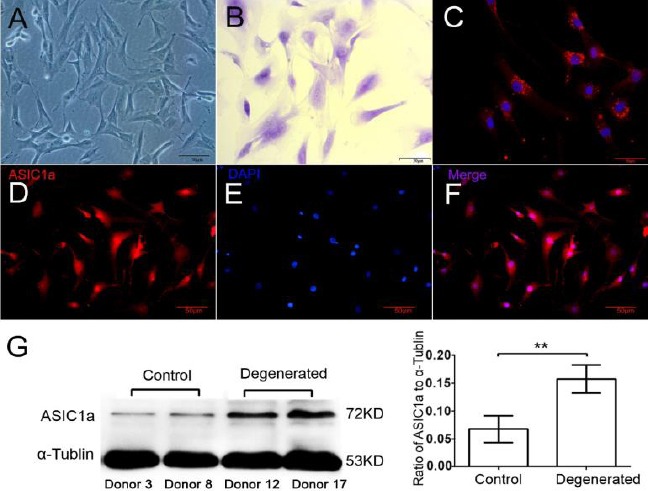
Figure 1.

Characterization of primary cultured human NPCs and the expression of ASIC1a. (A) Phase contrast Microscope. (B) Toluidine blue staining (ACAN). (C) Immunofluorescent staining (COL2 and DAPI). (D, E, F) Immunofluorescent staining (ASIC1a and DAPI). (G) Quantified ASIC1a expression in healthy (donors 3, 8) and degenerated (donors 12, 17) NPCs. Compared to the healthy NPCs, ASIC1a expression was significantly higher in degenerated cells (P<0.01, n=10). Pictures are representative of n=10 donors (donors 1–10, donors 11–20)
