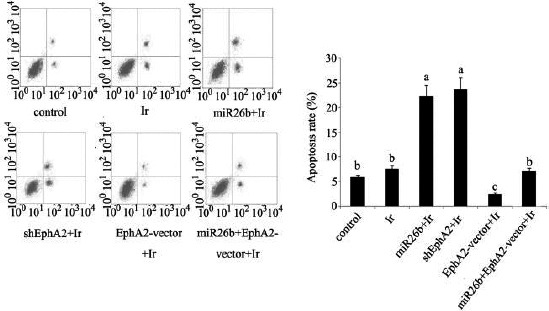
Figure 6.

Apoptosis rates of HCC 97H cells following different treatments
Before exposure to irradiation at dose of 1 Gy, HCC 97H cells were separately transfected with miR-26b mimics, EphA2 over-expression vector and EphA2-small hairpin RNA and cells that co-transfected with miR-26b mimics and EphA2 overexpression vector. Apoptosis rate was tested by using Annexin V-fluorescein isothiocyanate / PI apoptosis kit and flow cytometer. The horizontal axes of the flow cytometer images represent Annexin V FITC, and the vertical axes represent PI. Each bar represents the mean of three independent experiments. Bars not sharing a common letter differ (P < 0.05). Ir: irradiation; miR-26b: miR-26b mimics; EphA2-vector: EphA2 over-expression vector; shEphA2: EphA2-small hairpin RNA
