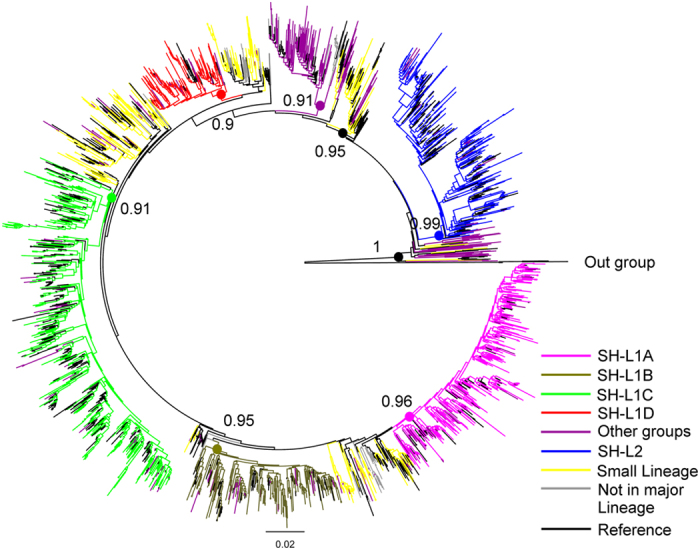
Figure 1. Phylogenetic analysis of lineages/sub-lineages.

The phylogenetic tree was constructed using approximately-maximum-likelihood method based on pol region (HXB2: 2, 253 to 3, 306 nt) in FastTree 2.3. The nucleotide substitution mode was GTR + G + I. The bootstrap value ≥0.9 was identified as a lineage/sub-lineage and was indicated at all relevant nodes. HIV-1 subtype C was chosen as an out-group in the rooted tree. The various lineages/sub-lineages were color-coded.
