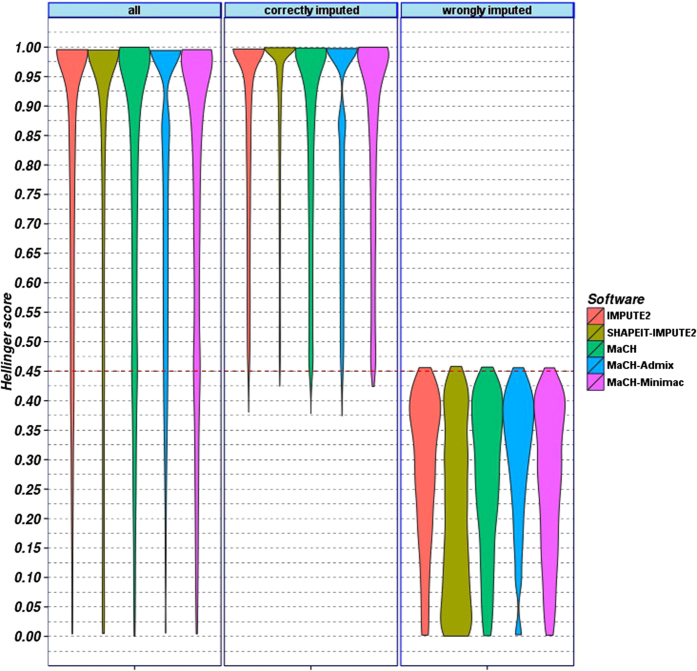
Figure 1. Violin plot of Hellinger scores of genotypes imputed with five different frameworks.
Results of African-Americans (AfAm) population are shown. We present results for all imputed genotypes, and separately, for cases where best guess genotypes match true genotypes (correctly imputed) or not (wrongly imputed). A Hellinger score > = 0.45 almost always ensured that the best-guess genotype matches the true genotype.

