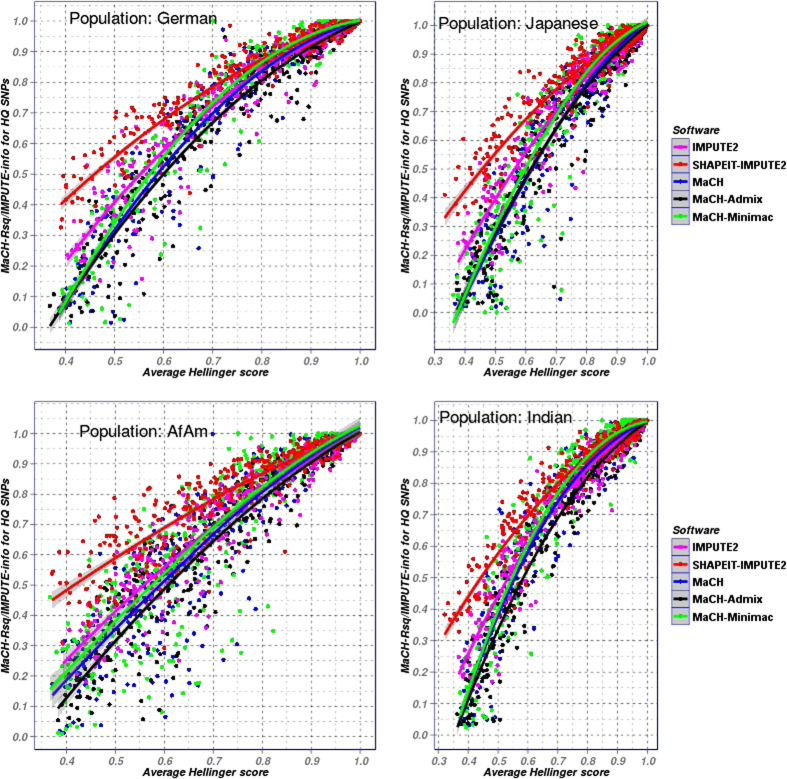
Figure 2. Scatterplot between average Hellinger score and Mach-Rsq/IMPUTE-info score for four different POPRES populations imputed with MaCH (using YRI reference panel), MaCH-Minimac (using YRI reference panel), MaCH-Admix, IMPUTE2 and SHAPEIT-IMPUTE2 (using admixed reference panels).
For the same Hellinger score, Info scores of SHAPEIT-IMPUTE2 are clearly inflated compared to IMPUTE2.

