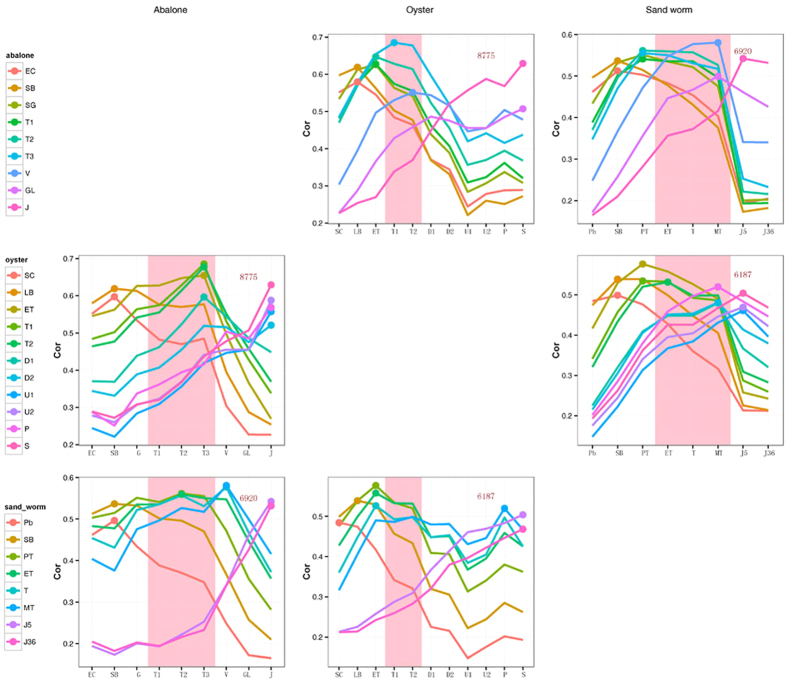
Figure 4. Transcriptome similarities of the different development stages between species.
The Spearman correlation coefficients (ρ) of the transcriptome profiles of the different development stages were calculated in a pairwise manner between species. The x-axis indicates the development stages stated in the corresponding column header. The differently colored lines indicate the different development stages of the species stated in the corresponding row header. The pink area designates trochophore stage. The highest ρ value throughout the developmental stages is indicated by a point on the corresponding line. The numbers in each panel show the gene numbers used for the analysis.

