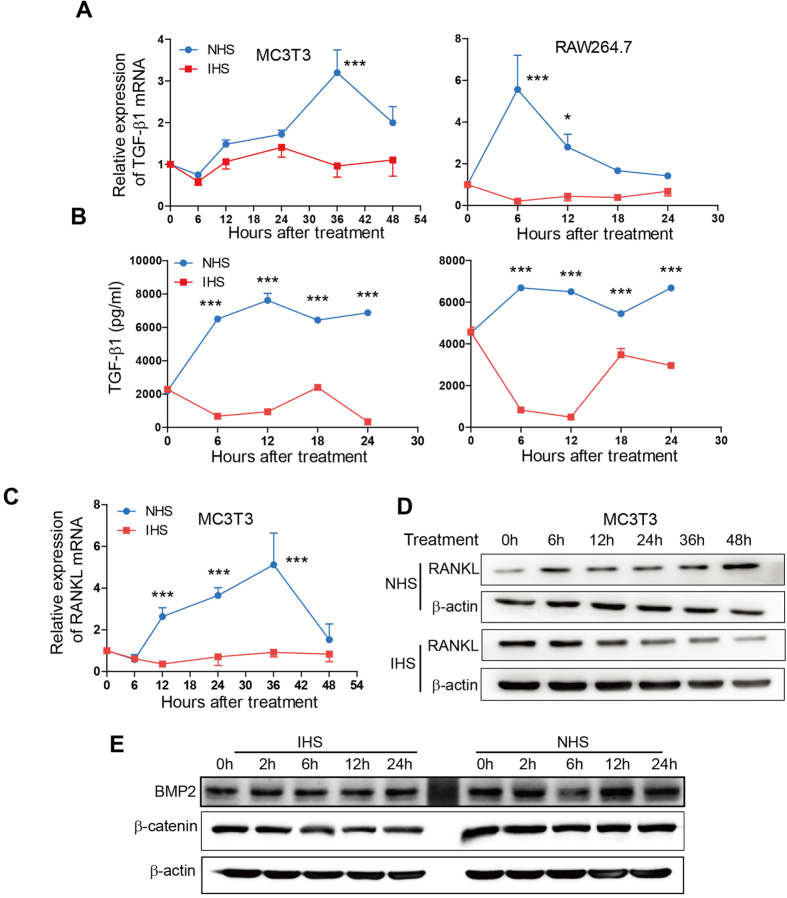
Figure 6. Complement Activation Increase the levels of TGF-β1 and/or RANKL.
(A–D) Complement activation by zymosan and NHS treatment (blue curve) increased the levels of TGF-β1 mRNA (A) and protein (B) in MC3T3-E1 and RAW264.7 cells, or the levels of RANKL mRNA (C) and protein (D) detected by qRT-PCR (A,C), ELISA (B) or immunoblotting (D) compared with zymosan and IHS treatment (red curve). Experiment was performed in triplicate and data represents mean ± SEM. *P < 0.05; **P < 0.01; and ***P < 0.001. (E) Complement activation slightly increased the level of BMP2 but not β-catenin. The blot images shown in (D) and (E) were cropped, and the original images correspond to Figure S4A,B, respectively.

