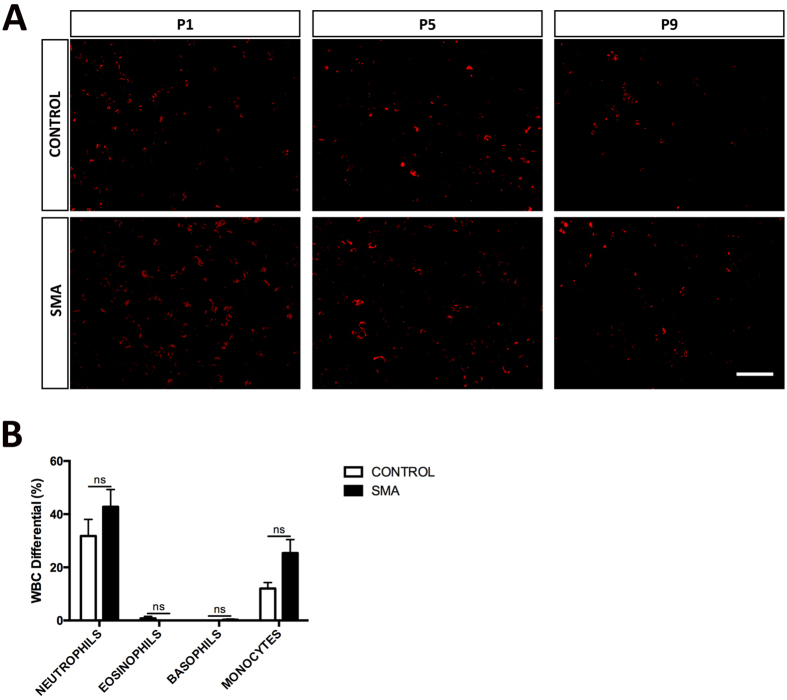
Figure 6. Myelopoiesis Does Not Appear to Be Affected in SMA Liver.
(A) Representative micrographs labelled with the CD11b to show myeloid leukocytes (red), in sections of liver obtained from Taiwanese mice. Scale bar, 50 μm. (B) WBC differential showing the percentage of granulocytes and monocytes in control and SMA blood samples obtained from P8 Taiwanese mice. p values were calculated using two-tailed Student’s t-test. Error bars, mean ± s.e.m. (n = 4 mice per group).

