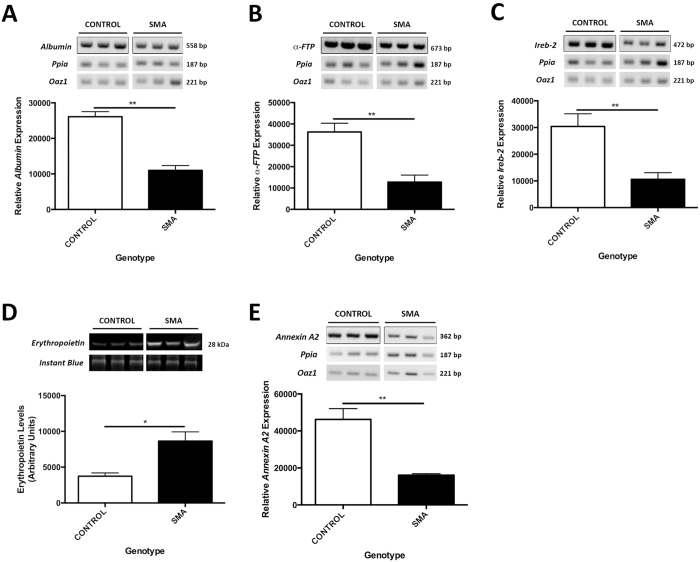
Figure 7. Molecular Pathways are Modified in SMA Liver.
Semi-quantitative RT-PCR analysis of albumin (A), α-FTP (B), Ireb-2 (C) and Annexin A2 (E) transcripts in control and SMA livers normalised to Ppia and Oaz1. (D) Total erythropoietin protein levels analysed by Western Blot and normalised to the total protein (Instant Blue). p values were calculated using two-tailed Student’s t-test. Error bars, mean ± s.e.m. (n ≥ 3 mice per group). For uncropped gels/blot see Supplementary Figure 1.

