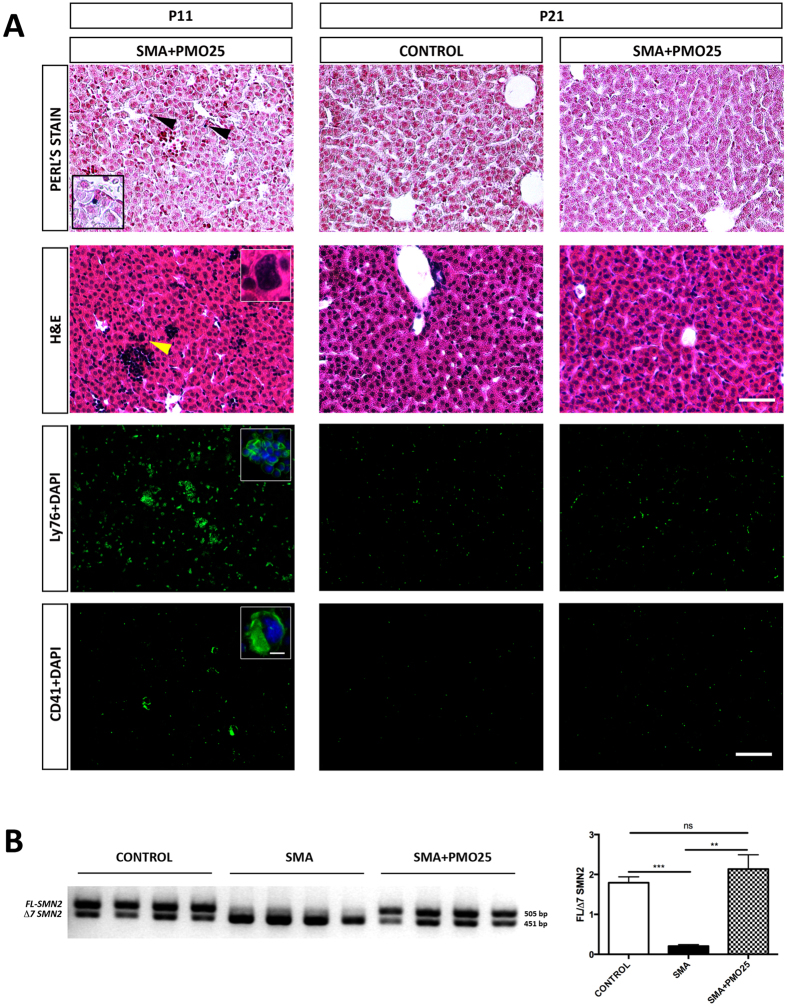
Figure 8. Antisense Treatment Prolonged Life and Normalised Liver Development in SMA.
(A) Representative micrographs of Perl’s, H&E, Ly76, and CD41 staining of liver obtained from treated and non-treated mice at two different time-points, P11 and P21. Note the persisting presence of iron deposits (black arrowheads, magnified panel), predominant erythroblastic islands, and megakaryocytes in SMA treated liver at P11. This pathology appears to be completely ameliorated at P21. Scale bar: Perl’s and H&E staining, 50 μm; Ly76 and CD41 staining, 100 μm; Magnified panel, 10 μm. (B) Semi-quantitative RT-PCR analysis of the ratio of FL-SMN2 to Δ7 SMN2 transcripts between Control, SMA and antisense treated SMA liver at P11. p values were calculated using two-tailed Student’s t-test. Error bars, mean ± s.e.m. (n = 4 mice per group). For uncropped gel see Supplementary Figure 2.

