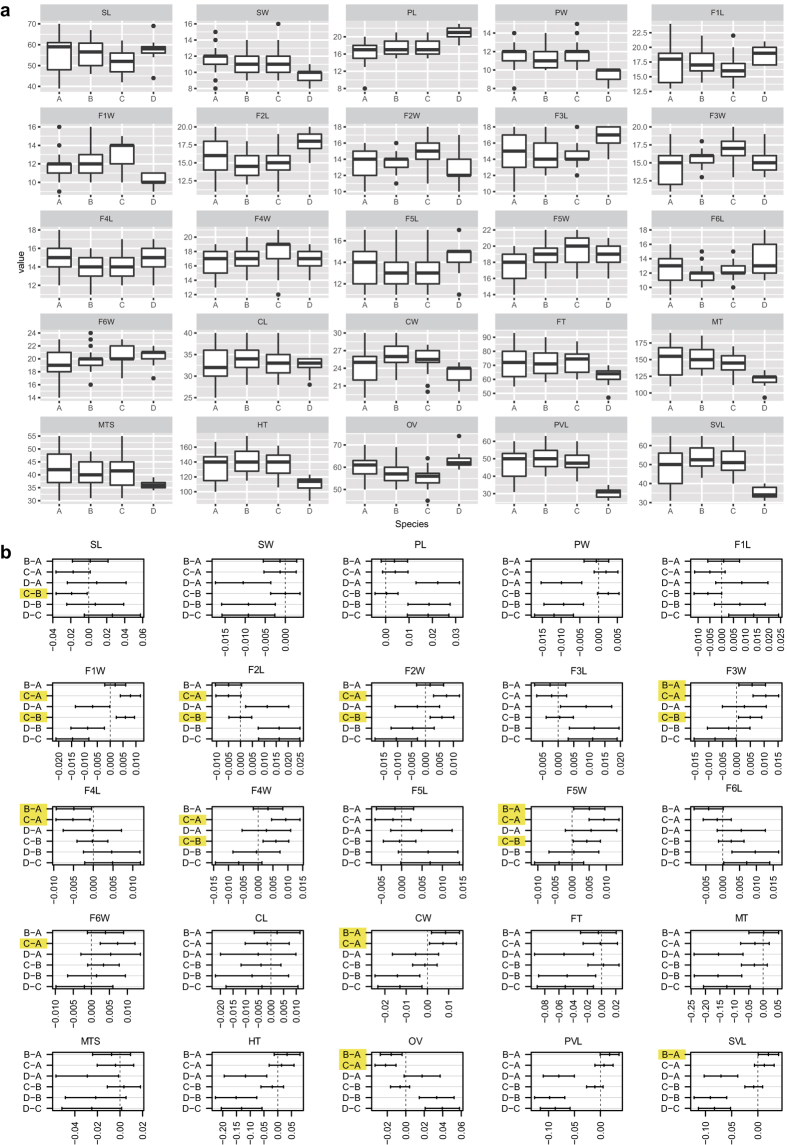
Figure 1.
(a) Boxplot of the distribution of the measurements of 25 characters (for Abbreviations of the Character names, see Table 1). The horizontal thick bar represents the median value, the box includes 50% of the data, the whiskers extend to cover 95% of the distribution. (b) Post hoc comparisons of each morphological character using Tukey HSD test at 95% family-wise confidence level (no significant differences if zero included in confidence intervals), significant differences between characteristics of A, B and C are highlighted with yellow. A = E. eulecaniumiae, B = E. rhodococcusiae, C = E. sasakii, and D = E. infelix.

