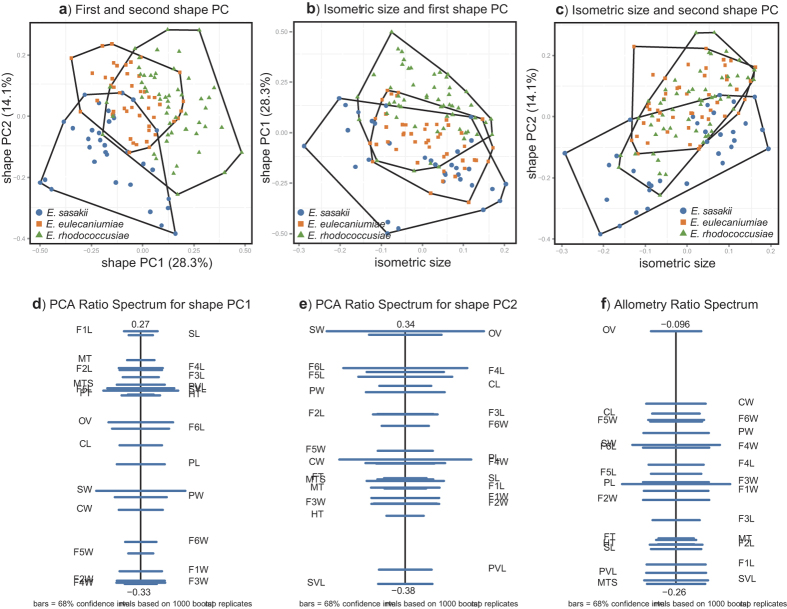
Figure 2. Results of multivariate ratio analysis (MRA) for females of Encyrtus sasakii, E. eulecaniumiae and E. rhodococcusiae.
a) Scatterplot of a principal component analysis (PCA) in shape space. (b) Isometric size versus first principal component in shape space. (c) Isometric size versus second principal component in shape space. (d) PCA ratio spectrum of the first principal component. (e) PCA ratio spectrum of the second principal component. (f) The allometry ratio spectrum. Confidence intervals [horizontal bars in (d,e,f), were estimated with a bootstrap of the original values of z directly from the empirical distribution.

