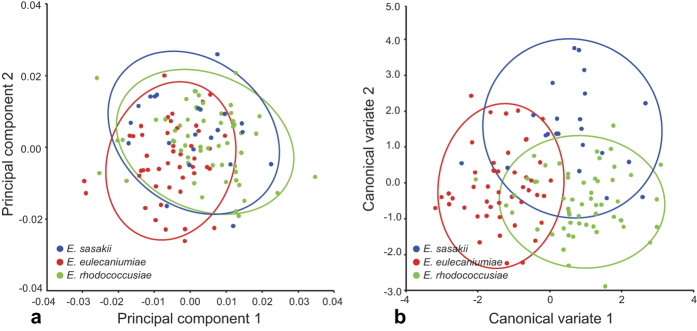
Figure 4.
(a) Scatter plots constructed from principal component analyses (PCA) of the data set of seven landmarks from the forewings of the three Encyrtus species. In the scatter plots, the first and second principal components are plotted on the x and y axis, respectively. (b) Scatter plots constructed from canonical variate analysis (CVA) of the landmark data set.

