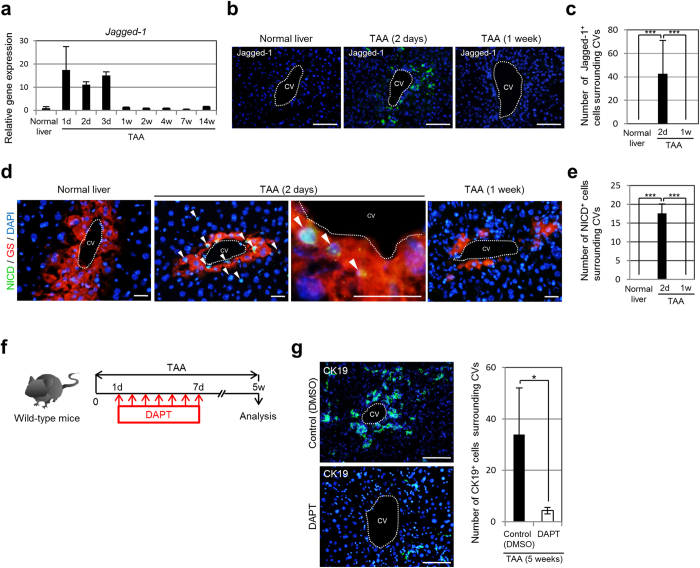
Figure 2. Transient Notch ligand expression is associated with requirement of Notch activation for conversion of pericentral hepatocytes into biliary lineage cells in the liver of TAA-administered mice.
(a) RT-qPCR analyses of Jagged-1 expression were carried out using total RNA derived from the livers of normal and TAA-administered mice. All data were normalized by the value for Gapdh and expressed as fold differences from the value in the normal liver. The data represent means ± SD (n = 3). (b) Immunofluorescence staining of Jagged-1 in the livers of normal and TAA-administered mice. (c) Numbers of Jagged-1-positive cells surrounding CVs in the livers of normal and TAA-administered mice (10 CVs per mouse were analyzed in discontinuous liver sections from 3–4 different liver lobes). The data represent means ± SD (n = 3). (d) Co-immunofluorescence staining of the NICD with GS in the livers of normal and TAA-administered mice. NICD-positive hepatocytes (arrowheads) are observed around the CVs after 2 days of TAA administration. (e) Numbers of NICD-positive cells surrounding CVs in the livers of normal and TAA-administered mice (10 CVs per mouse were analyzed in discontinuous liver sections from 3–4 different liver lobes). The data represent means ± SD (n = 3). (f) Experimental procedure to inhibit Notch signal activation during TAA treatment by injecting DAPT into mice. (g) Immunofluorescence staining of CK19 in the livers of DMSO-injected (control) and DAPT-injected mice after 5 weeks of TAA administration, and numbers of CK19-positive cells around the CVs in the livers of these mice (20 CVs per mouse were analyzed in discontinuous liver sections from 3–4 different liver lobes). The data represent means ± SD (n = 3). DNA was stained with DAPI (blue). Scale bars: 100 μm (b,g) and 25 μm (d). d, day(s). w, week(s). *P < 0.05. ***P < 0.001.

