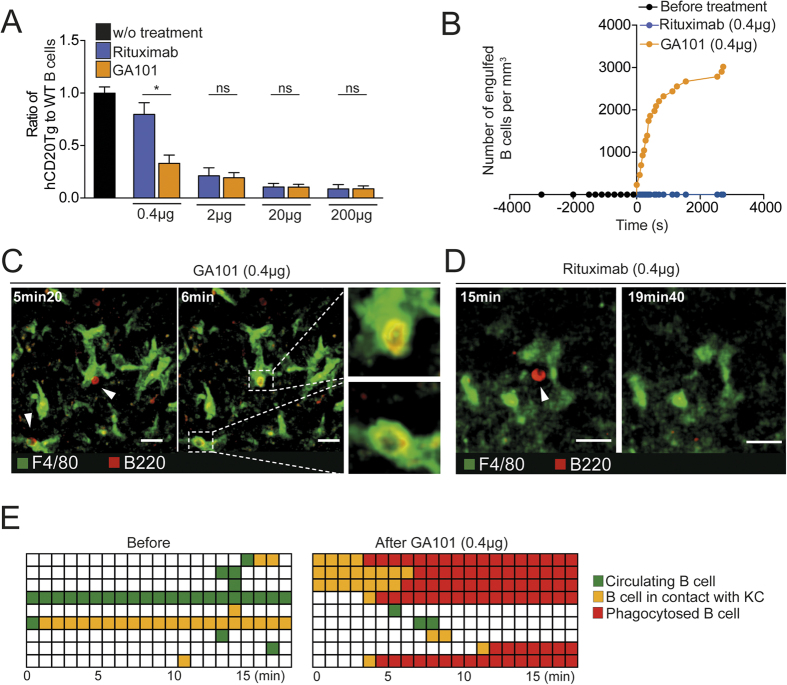
Figure 4. Obinutuzumab triggers enhanced Ab-dependent phagocytosis by Kupffer cells in vivo compared to rituximab.
(A) Splenocytes from WT or hCD20Tg mice were isolated, labeled and co-transferred into WT recipient mice. After 24 h, mice were treated i.v. with different doses of rituximab or GA101 and blood was analyzed 1 hr later by flow cytometry. The summary bar charts show the ratio of hCD20Tg to WT B cells (non depleted, used as an internal control) 1 h after injection of the indicated dose of rituximab or GA101. (B–E) Intravital imaging of the liver of hCD20Tg mice during anti-CD20 treatment. Kupffer cells (green) and B cells (red) were labeled using anti-F4/80 Ab and anti-B220 Fab fragments, respectively. (B) Representative curve showing the number of engulfed B cells (normalized per mm3) in the liver following 0.4 μg GA101. (C) Figure shows representative two-photon images before and after treatment with low doses of GA101 (0.4 μg), highlighting efficient B cell phagocytosis by Kupffer cells (white squares and insets). Scale bar, 25 μm. (D) Representative two-photon images highlighting the absence of B cell phagocytosis following 0.4 μg rituximab. Scale bar, 20 μm. (E) Each line represents the cell behavior after anti-CD20 injection. Green squares represent cicrculating B cells, yellow squares represent contact between a B and Kupffer cell and red squares represent engulfed B cells. Representative of 2–4 independent experiments. Results are shown as mean ± SEM. Significance was assessed using an unpaired Student t-test.

