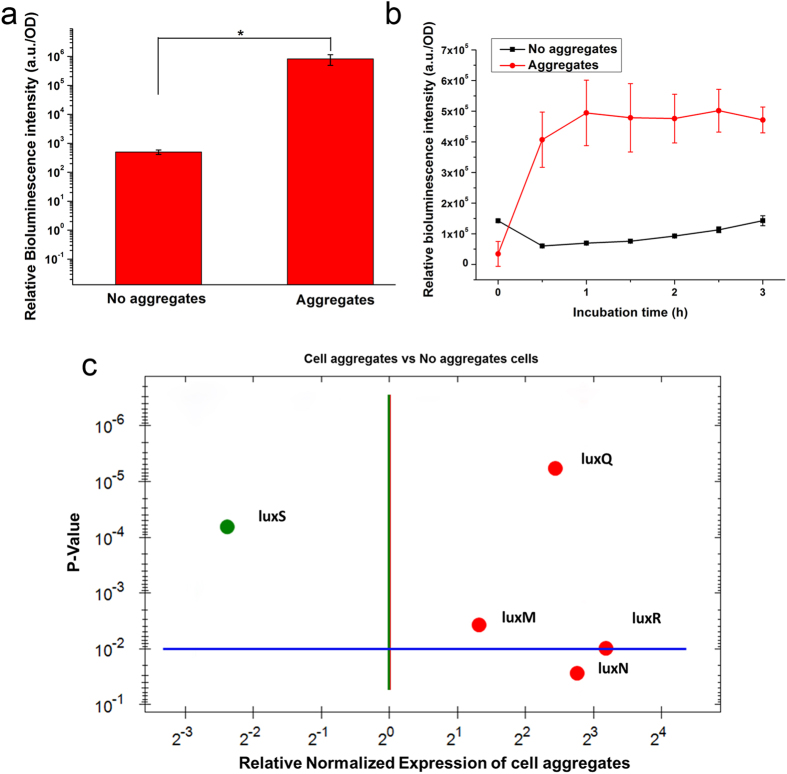
Figure 2. The QS capacities of cells with different spatial distributions in microcapsules.
(a) The relative bioluminescence intensity (RBI) of V. harveyi cells in structures with different spatial distributions. (b) The QS response of V. harveyi cells in structures with different spatial distributions when an equal volume of sterile supernatant was added as an exogenous AI. (c) The expression levels of QS-related genes in different spatial distributions. The RNA polymerase A subunit gene (rpoA) was used as a housekeeping gene, and the results were normalized to the no-aggregate group. Genes in green color indicated down-regulated expression and genes in red color indicated up-regulated expression. Error bars represent the standard deviation of three replicates. Significant differences between groups were analyzed by t-test. Single asterisk indicates significant difference (p < 0.05).

