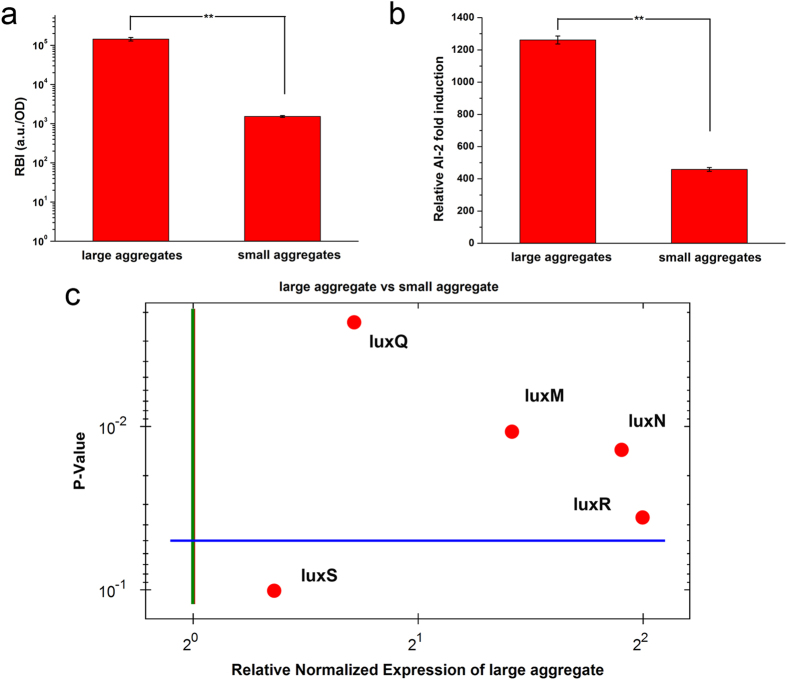
Figure 4. The QS capacities of cells with different aggregate sizes in microcapsules.
(a) The relative bioluminescence intensity (RBI) of V. harveyi cells in aggregate with different sizes. (b) The relative AI-2 induction of different aggregate sizes. AI-2 induction was quantified using a biological method employing V. harveyi BB170 as a reporter strain, and the supernatant from BB152 was used as a positive control. (c) The expression levels of QS-related genes in aggregates with different sizes. The RNA polymerase A subunit gene (rpoA) was used as a housekeeping gene, and the results were normalized to the SA group. Genes in green color indicated down-regulated expression and genes in red color indicated up-regulated expression. Error bars represent the standard deviation of three replicates. Significant differences between groups were analyzed by t-test. Single asterisk indicates significant difference (p < 0.05) and double asterisk indicates significant difference (p < 0.01).

