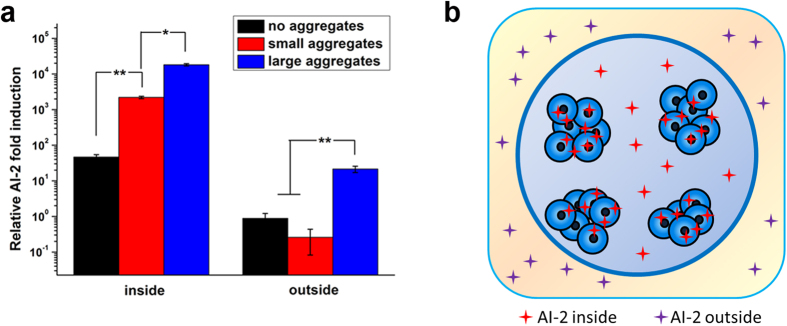
Figure 5. The AI-2 distribution inside and outside microcapsules.
(a) The concentrations of AI-2 induced in the context of three types of spatial distributions of cells were quantified with a biological method. (b) A schematic of the AI-2 distribution. Most of the AI-2 was restricted in the cell aggregates, and the remainder diffused outside the microcapsules. Error bars represent the standard deviation of three replicates. Significant differences between groups were analyzed by t-test. Single asterisk indicates significant difference (p < 0.05) and double asterisk indicates significant difference (p < 0.01).

