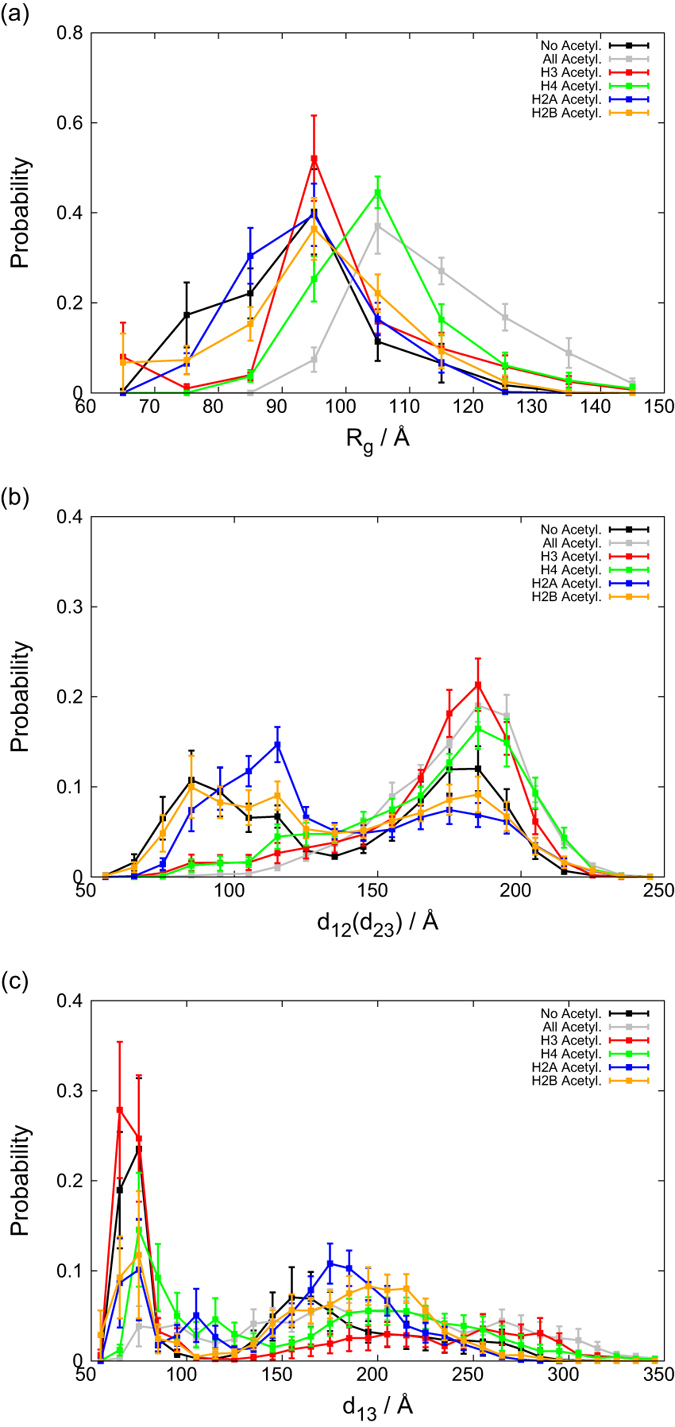
Figure 3. The simulated distributions of geometric parameters.

(a) The radius of gyration, Rg. (b) The distance between the centers of mass of neighboring nucleosomes. (c) The distance between the centers of mass of the first and third nucleosomes. Colors are used to distinguish different acetylation states as indicated in the figures.
