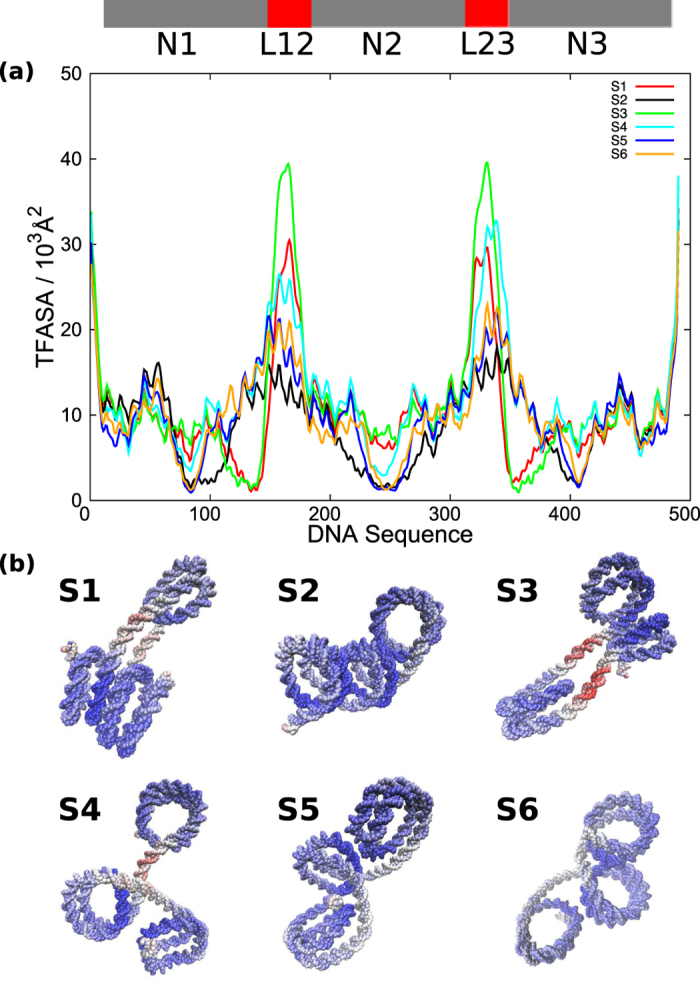
Figure 8. The local transcription factor accessible surface area (TFASA) for 6 representative structures (Sn, with n = 1, 2…, 6).

(a) The local TFASA is plotted against the DNA sequence. (b) The TFASA is represented as colors on the structures. The red, white, and blue indicate large, medium, and small TFASAs, respectively. Structural images are generated by VMD.
