An official website of the United States government
Here's how you know
Official websites use .gov
A
.gov website belongs to an official
government organization in the United States.
Secure .gov websites use HTTPS
A lock (
) or https:// means you've safely
connected to the .gov website. Share sensitive
information only on official, secure websites.

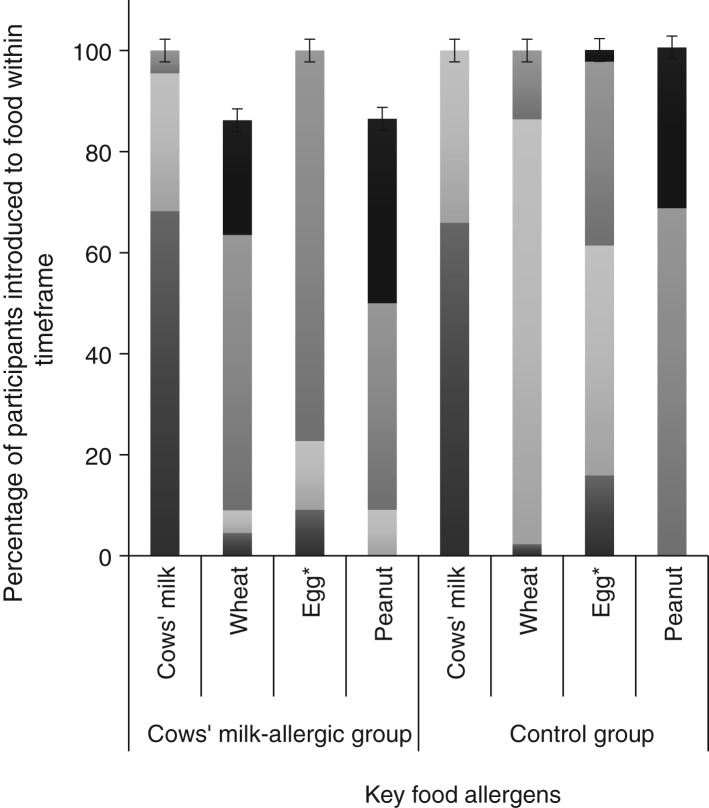
 , 9–12 months;
  , 6–9 months;
  , 3–6 months;
  , < 3 months. The error bars indicate 95 % confidence intervals.