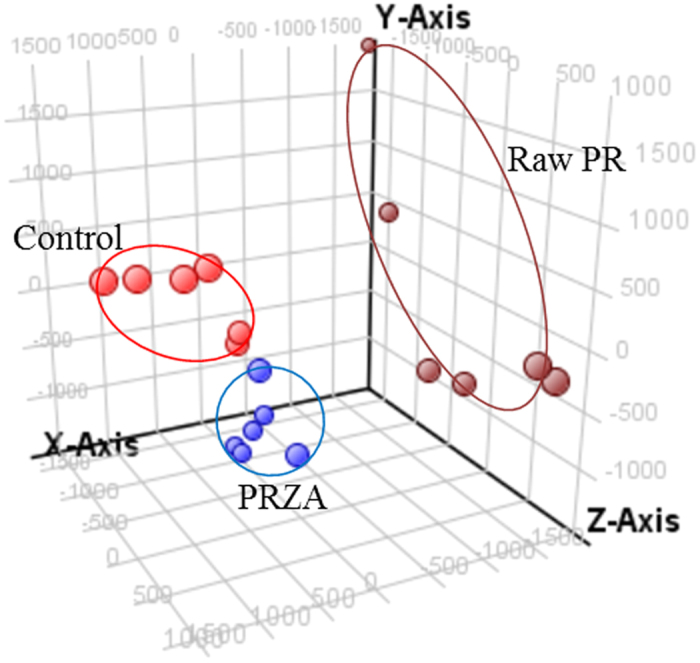
Figure 4. Results of the multiple pattern recognition of the serum metabolites in control, raw PR and PRZA groups at the time point of day 14.

. (red  ) Control group, (brown
  ) Raw PR group, (blue
  ) PRZA group.

. (red  ) Control group, (brown
  ) Raw PR group, (blue
  ) PRZA group.