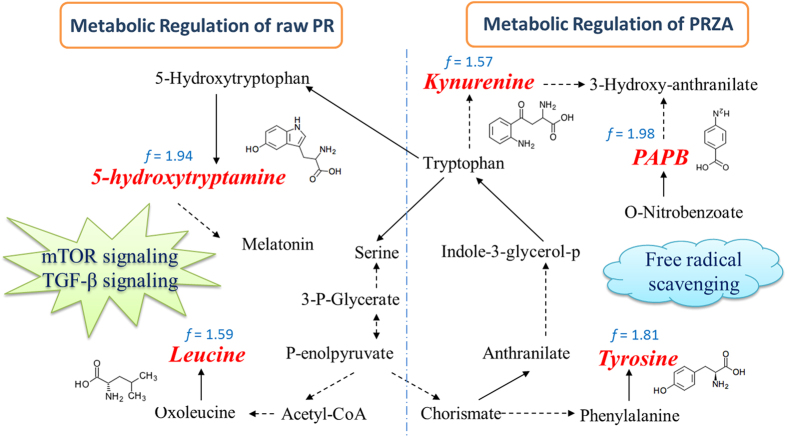
Figure 8. The characteristic metabolites and the regulated metabolic regulatory networks of raw PR and PRZA.
Red italics molecules represent characteristic metabolites up-regulation in raw PR group and PRZA group; solid lines between molecules indicate a direct transforming relationship, while dotted lines indicate indirect relationships. “f” represents the fold change value of raw PR vs. control or PRZA vs. control.

