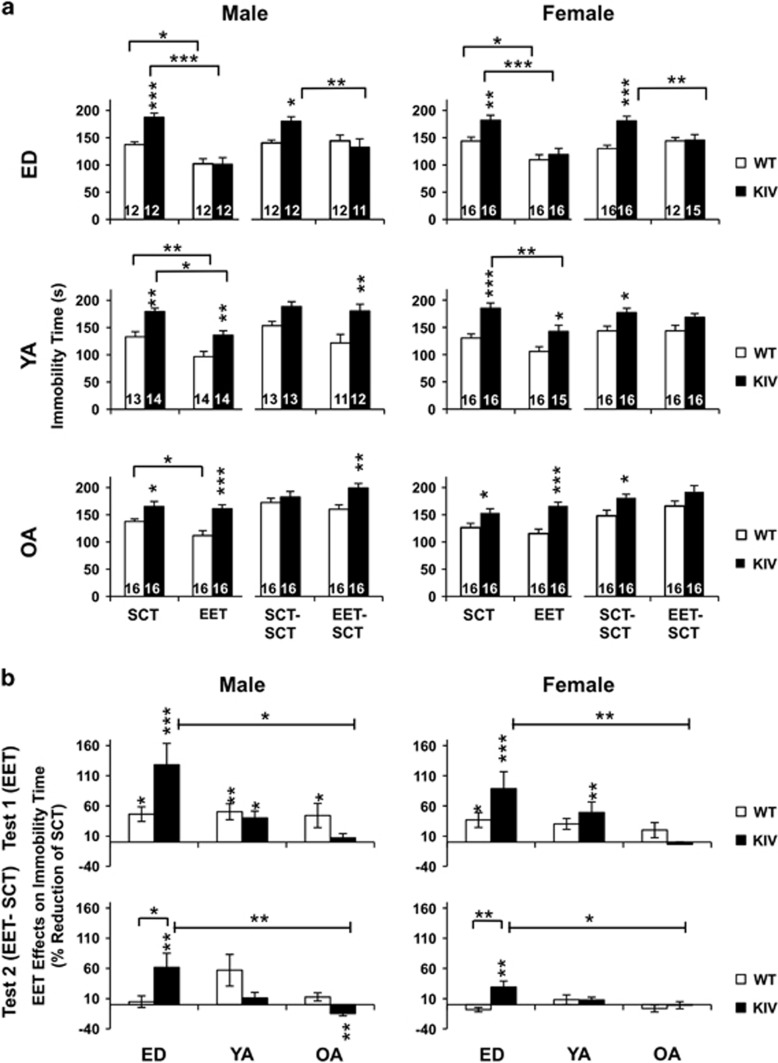
Figure 4.
EET effects on immobility time in the tail-suspension test across ages. (a). Immobility time in WT and KIV mice at T1 (SCT/EET) and T2 (SCT–SCT/EET–SCT). Asterisks on the columns show a significant difference between genotypes. (b). EET effects shown as % SCT across ages at T1 (top) and at T2 (bottom). Asterisks on the columns show a significant effect of EET compared with SCT. ED, early-life development; EET, enriched environment treatment; KIV, knock-in BDNF-promoter IV; OA, old adult; SCT, standard condition treatment; WT, wild-type; YA, young adult. *P<0.05, **P<0.01, ***P<0.005. N=11–16.

