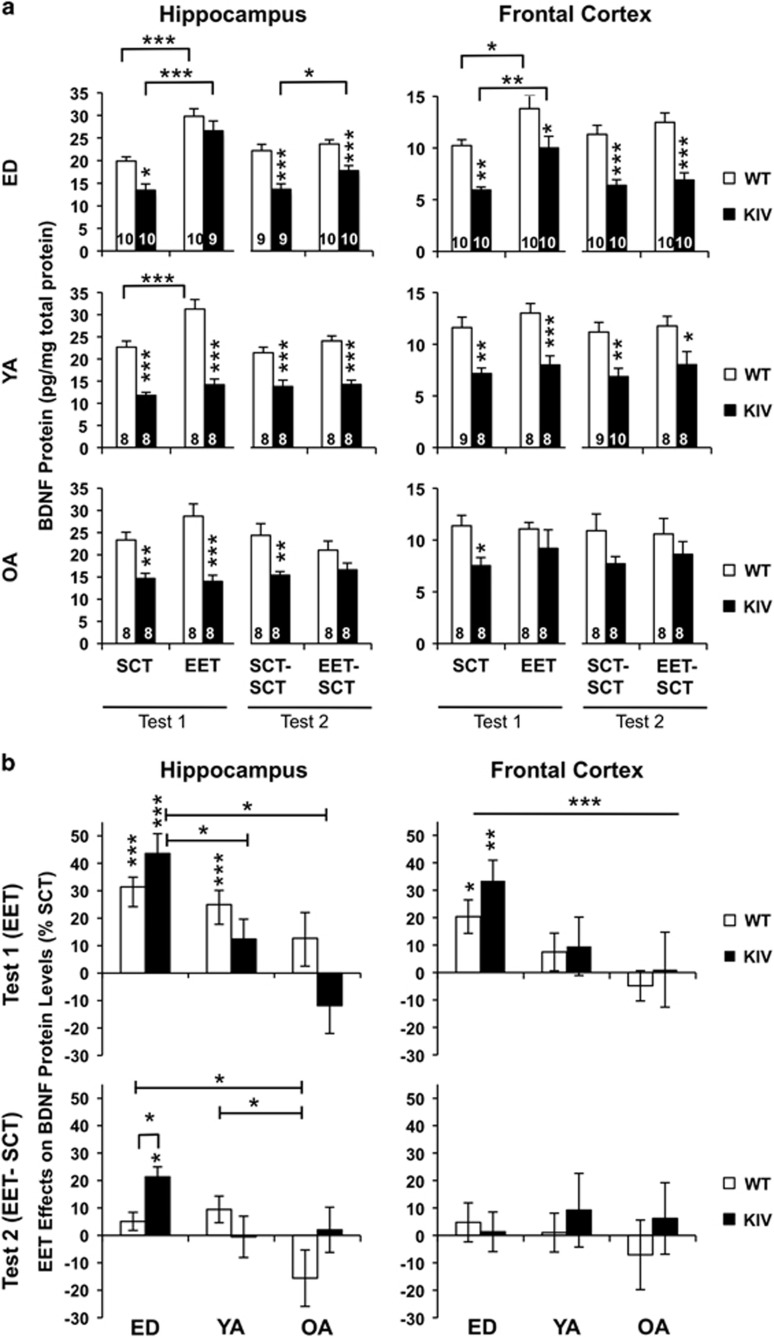
Figure 5.
EET effects on BDNF protein levels in the hippocampus (left) and frontal cortex (right) measured by ELISA. (a) BDNF levels in WT and KIV mice after EET (SCT/EET, T1), then after 1 month of SCT (SCT–SCT/EET–SCT, T2). Asterisks on the columns show a significant difference between genotypes. Data are combined (N=8–10) from male (N=4–5) and female (N=4–5) mice because no gender differences were observed. (b) EET effects shown as % SCT across ages at T1 (top) and at T2 (bottom). Asterisks on the columns show a significant effect of EET compared to SCT. BDNF, brain-derived neurotrophic factor; ED, early-life development; EET, enriched environment treatment; KIV, knock-in BDNF-promoter IV; OA, old adult; SCT, standard condition treatment; WT, wild-type; YA, young adult. *P<0.05, **P<0.01, ***P<0.005.

