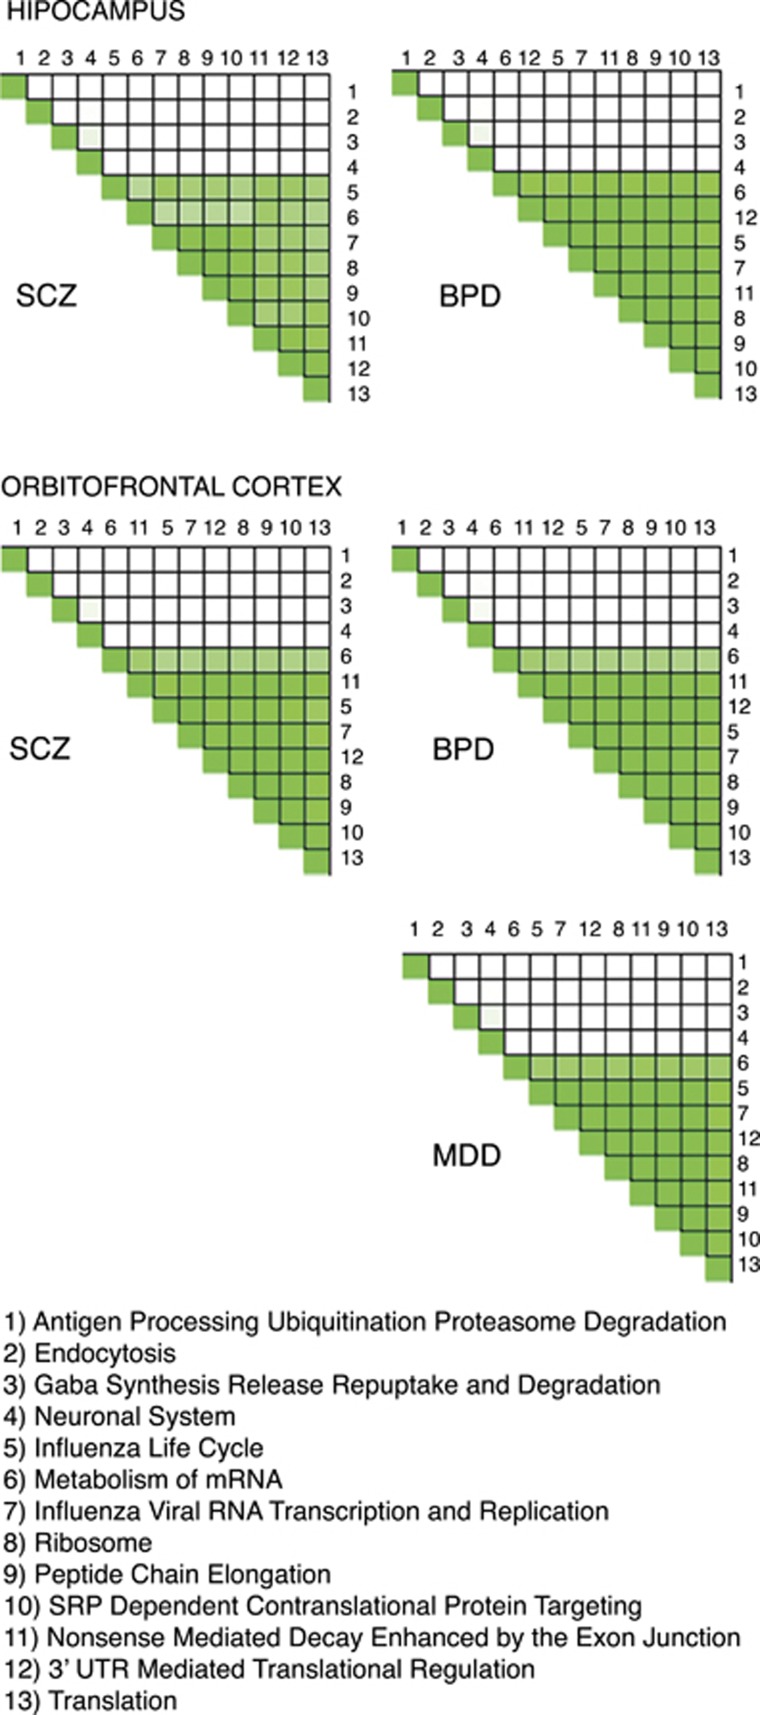
Figure 2.
Overlap between lists of genes driving enrichment of gene sets. Darker green indicates higher degree of overlap. As different genes may contribute to enrichment of the gene sets in each sample group, separate heat map is plotted for each comparison. The top two plots denote genes with increased expression in SCZ and BPD relative to control in the hippocampus, while the bottom three plots denote genes with increased expression in SCZ, BPD and MDD in the OFC. BPD, bipolar disorder; MDD, major depressive disorder; mRNA, messenger RNA; OFC, orbitofrontal cortex; SCZ, schizophrenia; UTR, untranslated region.

