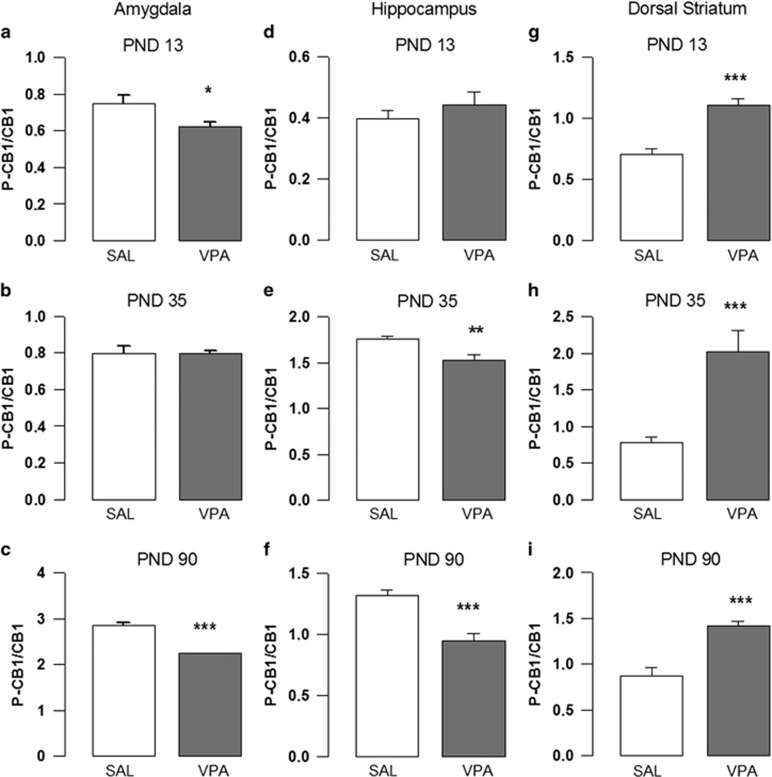
Figure 1.
Activation of CB1 receptors. Ratio between phosphorylated and total CB1 receptor protein in the amygdala (a–c), hippocampus (d–f) and dorsal striatum (g–i) of VPA- and SAL-exposed offspring, evaluated at PNDs 13 (n (SAL)=6, n (VPA)=6), 35 (n (SAL)=6, n (VPA)=6) and 90 (n (SAL)=6, n (VPA)=6). Data represent mean±s.e.m.; *P<0.05; **P<0.01; ***P<0.001 (Student's t-test). PND, postnatal day; SAL, saline; VPA, valproic acid.

