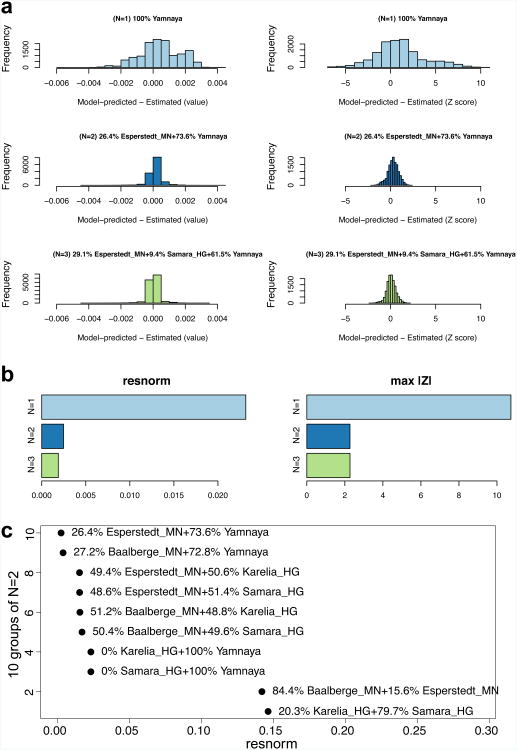
Extended Data Figure 2.
Modelling Corded Ware as a mixture of N=1, 2, or 3 ancestral populations. (a) The left column shows a histogram of raw f4 statistic residuals and on the right Z-scores for the best-fitting (lowest squared 2-norm of the residuals, or resnorm) model at each N. (b), The data on the left show resnorm and on the right show the maximum |Z| score change for different N. (c) resnorm of different N=2 models. The set of outgroups used in this analysis in the terminology of Supplementary Information section 9 is ‘World Foci 15 + Ancients’.

