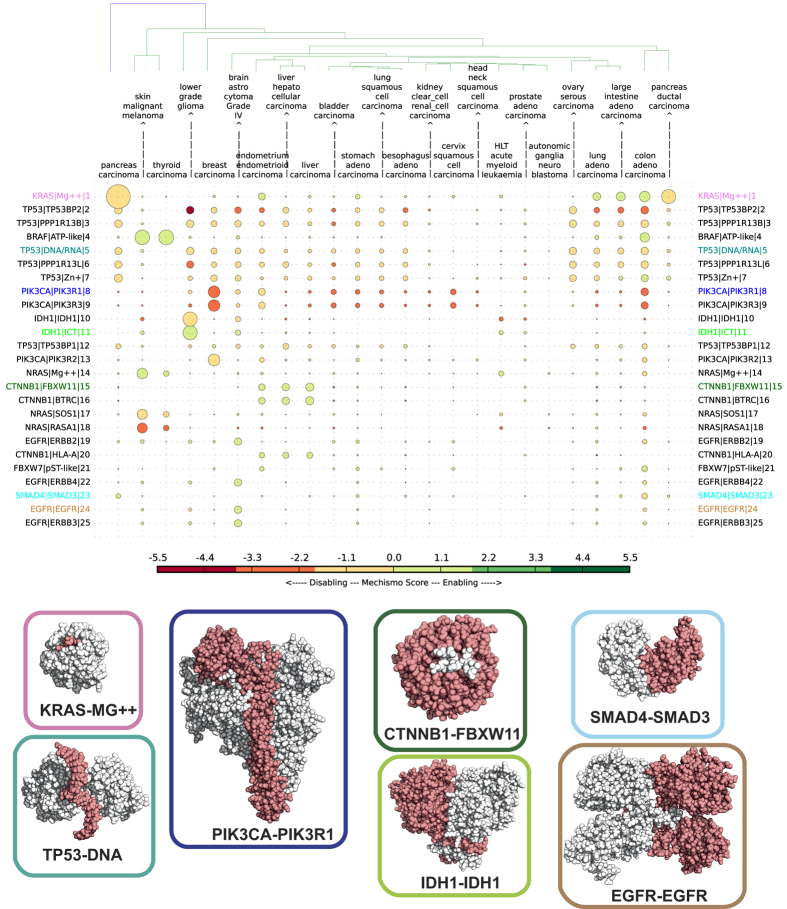
Figure 2. Cancer type specific interface perturbation matrix: for each of the most abundant 24 cancer types (columns), the 25 most frequently perturbed interfaces are shown (rows).
Each dot represents a perturbed interface, with the diameter being proportional to the sample frequency and the colour corresponding to the median of the Mechismo scores. When the same perturbed protein interface binds multiple chemicals (e.g.for KRAS or NRAS), only the one perturbed in the highest number of unique samples is reported. Space-filling representations of representative most perturbed interfaces (with the protein most affected by mutations coloured in white and the interacting partner in red): KRAS-MG++ (PDB ID: 5P21), TP53-DNA (PDB ID: 1TUP), PIK3CA-PIK3R1 (PDB ID: 3HMM), IDH1-IDH1 (PDB ID: 1T09), CTNNB1-FXBW11 (PDB ID: 1P22), EGFR-EGFR (PDB ID: 1IVO), SMAD4-SMAD3 (PDB ID: 1U7F).

