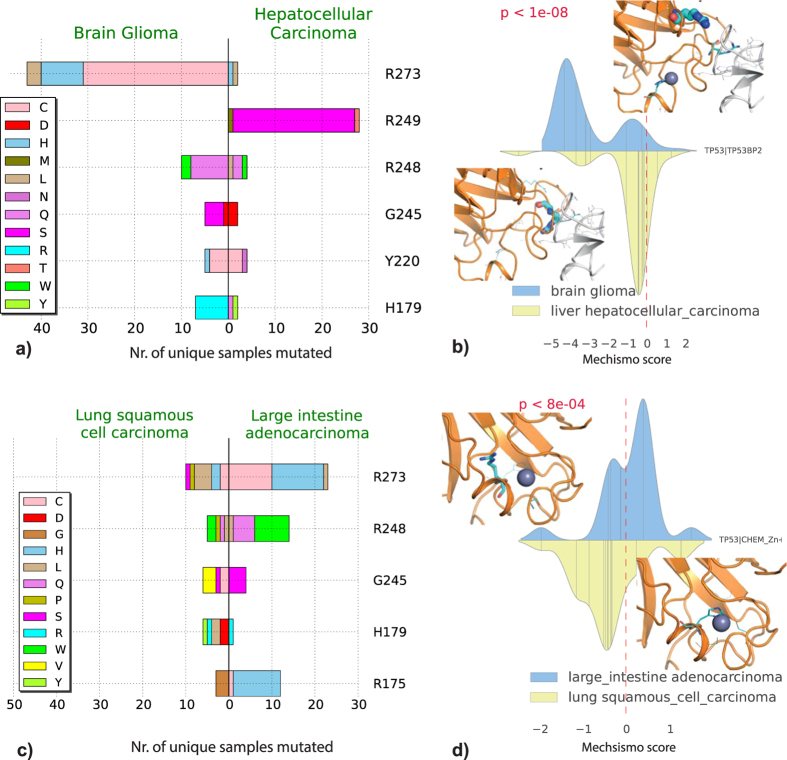
Figure 3.
TP53 interfaces significantly different in cancers: (a) mutational spectra of TP53 mutations in Glioma and Hepatocellular carcinoma (count cutoff ≥5) perturbing the interface with TP53BP2. (b) Mechismo score distribution and structure captions for the TP53 and TP53BP2 interface in Glioma and Hepatocellular carcinoma. Mutated residues are shown as sticks whose radius is proportional to the mutation count. Representations in (c,d) are the same as in (a,b), respectively, for the TP53-ZN++ interface in Lung Squamous Cell Carcinoma and Large Intestine Adenocarcinoma. In the density plots of Mechismo score distributions, bar x coordinates indicate variant Mechismo scores and the height is proportional to the number of samples containing variants.

