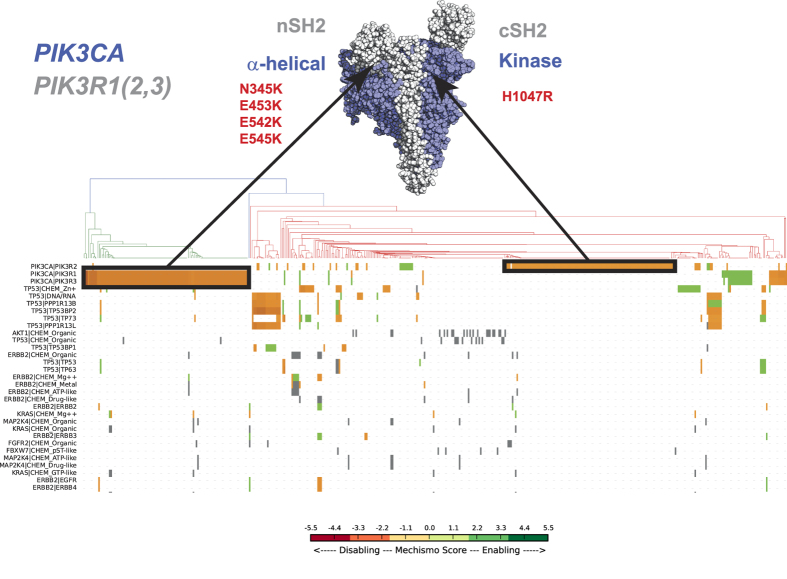
Figure 4. Breast carcinoma clustering based on Mechismo predictions: each column of the clustering matrix represent a sample, while each perturbed interface is represented on each row.
Each matrix element is coloured according to Mechismo score, ranging from red (disabling) to green (enabling). Mutually exclusive set of mutations of PIK3CA predicted to perturb the interaction with PIK3CA regulatory proteins are highlighted in blue on the clustering matrix as well as on a space-filling representation of PIK3CA and PIK3R1 and 2. The structure shows the C-terminal SH2 domain (cSH2) of PIK3R2 from a complex with PIK3CA (PDB: 2Y3A) previously fitted to a complex between PIK3CA-PIK3R1 (PDB: 3HMM).

