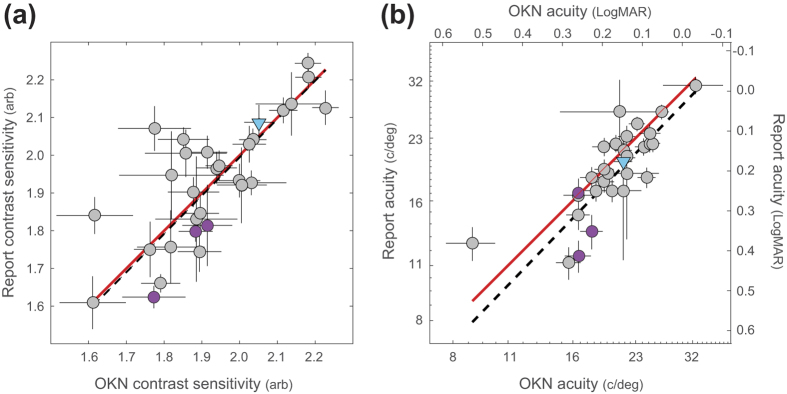
Figure 6.
Correlations between the OKN-based measures and perceptual report of (a) Contrast sensitivity and (b) visual acuity. Note that the range in contrast sensitivity estimates spans approximately half an octave, while 29 of the visual acuity estimates span a full octave (1 observer appeared to have much poorer visual acuity on both measures). The dashed lines represent the error-weighted correlations between each measure (Both R = 0.84, p < 0.0001), while the red lines demonstrate agreement. Data from 30 observers are shown, error bars indicate ±1σ of the estimates derived from bootstrapping the CSF fits. Purple symbols indicate observers who showed significant disagreement between OKN and report, and blue symbols indicate an observer who exhibited reversed OKN.

